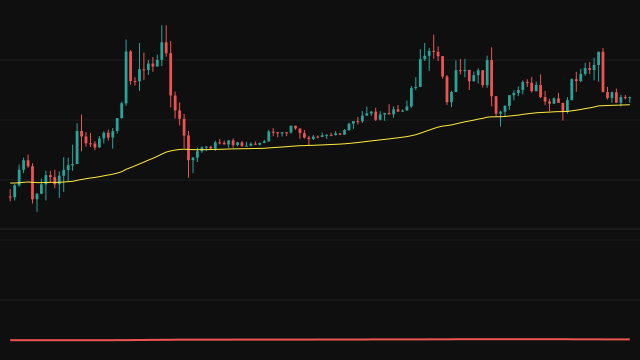
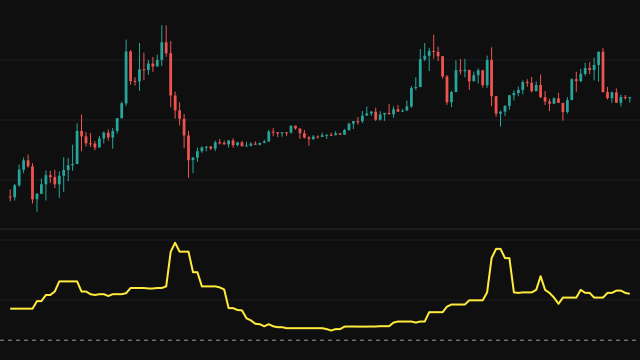
Median Absolute Percentage Error (MdAPE) scores how far a predicted series sits from an actual series, in percent of the actual. On every bar it takes the absolute gap between the two, divides it by the absolute actual value and multiplies by 100. If the actual value is too close to zero to divide by, the bar scores 0.
The study then takes the median of the last Length of those percentage errors. The median is found by nearest rank: the window is sorted and the value at position ceil(Length / 2) is returned, so an even window answers one of its own members rather than the average of the two middle values. With the default settings the actual series is the close and the predicted series is the open, so the reading is the typical size of the open to close move as a percentage of the close.
How to read Median Absolute Percentage Error
A low reading means the predicted series usually lands close to the actual one; a high reading means the typical miss is large. Because it is a median, a single bar with a huge error barely changes it, which makes it a steadier score than an average of the same errors. Compare it with a mean based error: if the mean jumps while the median stays flat, the error came from a few extreme bars.
The line has no value until Length bars have passed. It measures the size of the miss only, not its direction, and a percentage scale says little when the actual series sits near zero.
Settings
- Length
- How many bars of percentage error the median is taken over. A longer window moves more slowly.
- Actual
- The series treated as the truth. The error is measured as a percentage of this series.
- Predicted
- The series treated as the forecast that is scored against the actual one.
Frequently asked questions
Why use a median instead of the mean?
The median ignores how large the extreme errors are, so one bar with a very large miss changes the reading by at most one rank. The mean of the same errors can jump a long way on that one bar.
What happens with an even Length?
The window is sorted and the value at position Length divided by two is returned, so with 14 bars it is the 7th smallest error. It is always one of the errors in the window, never an average of two.
What does it measure with the default settings?
The actual series is the close and the predicted series is the open, so it reports the median size of each bar's open to close move as a percentage of the close.