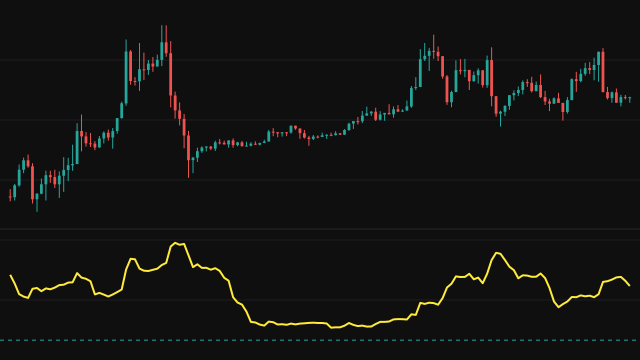
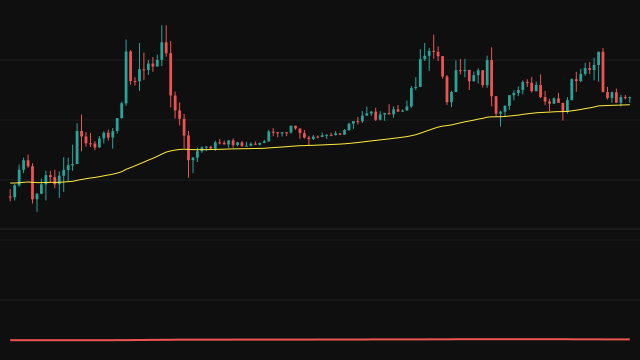
Mean %Error scores an exponential moving average as a forecast of price, in percent and with the sign kept. The average is taken over Period bars and seeded with the simple average of its first Period values. On every bar the study subtracts the average from the source, divides by the source and multiplies by 100. A bar where the source is exactly zero carries no error.
The signed percentage errors are averaged over the last Period bars, at most 4000, counting only the bars that carry an error. The reading starts on the first bar where the average exists and widens its window until it is full. Positive and negative errors cancel, so the result shows a persistent bias as a level away from zero.
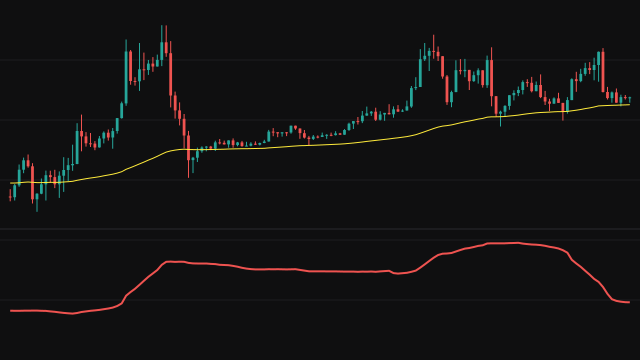
The error is plotted as a shaded area in its own pane, and the reference average is drawn on the price chart.
How to read Mean %Error (MPE)
A reading of 1.5 means price has, on balance, been about 1.5 percent above its average over the window, the shape of an uptrend. A negative reading means price has been below its average. Because it is a percentage, the reading can be compared between instruments.
A reading near zero does not mean price has been close to the average, only that the misses on each side have balanced. Pair it with MAPE to see how large the misses were.
Settings
- Source
- The price series measured against its own average. The close by default.
- Period
- The length of the reference EMA and of the averaging window, which is held to at most 4000 bars.
Frequently asked questions
How is MPE different from MAPE?
MAPE takes the absolute value of each percentage error, so it measures size. MPE keeps the sign, so it measures bias, and errors on opposite sides cancel.
What does a reading that stays above zero tell me?
Price has spent the window mostly above its EMA, which is typical of a sustained rise. The longer and higher it stays, the stronger the bias.
Why does the line start late?
The EMA has no value until the chart has Period bars, so the error cannot be measured before then.