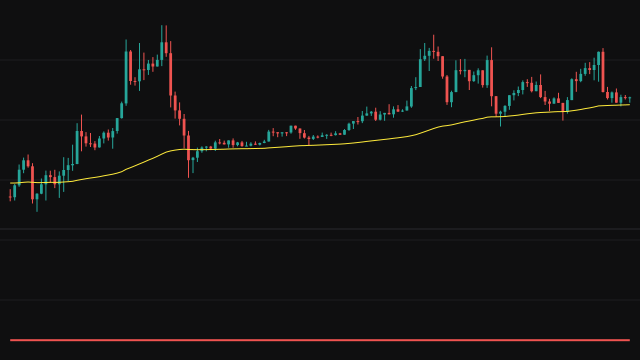
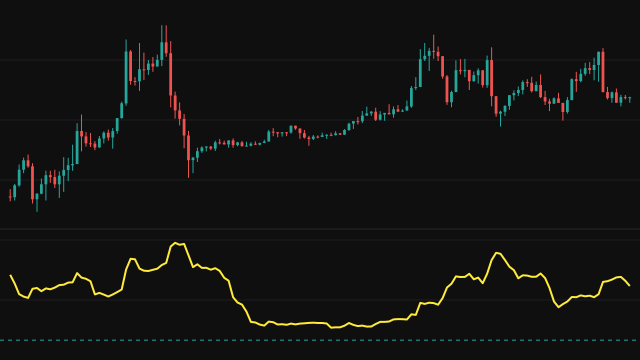
Mean Squared Error scores an exponential moving average as a forecast of price. The average is taken over Period bars and seeded with the simple average of its first Period values, so it has no value through the warmup. On every bar the study subtracts the average from the source and squares the result.
Those squared gaps are averaged over the last Period bars, counting only the bars that carry a gap. The reading starts on the first bar where the average exists and widens its window until it is full. Squaring makes every gap positive and gives large gaps far more weight than small ones, so one wide departure from the average lifts the reading sharply.
The error is plotted as a shaded area in its own pane, and the reference average is drawn on the price chart.
How to read Mean Squared Error (MSE)
A rising reading means price has been moving further from its average, and a spike marks a bar or a short run of bars that broke well away from it. A falling reading means price has settled close to its average.
The value is in squared price units, so it grows with the square of the price level and is not comparable between instruments. Its square root is the root mean squared error, back in price units. Compare the reading with its own history rather than with a fixed level.
Settings
- Source
- The price series measured against its own average. The close by default.
- Period
- The length of the reference EMA and of the window the squared error is averaged over.
Frequently asked questions
Why are the numbers so large?
The gaps are squared, so a gap of 100 price units contributes 10,000. The reading is in squared price units.
How is MSE different from MAE?
MAE averages absolute gaps, treating each miss in proportion to its size. MSE squares them first, so a few large misses dominate the reading.
Why is there nothing for the first bars?
The EMA is seeded from a simple average of its first Period values, so neither the average nor the error exists before the chart has Period bars.