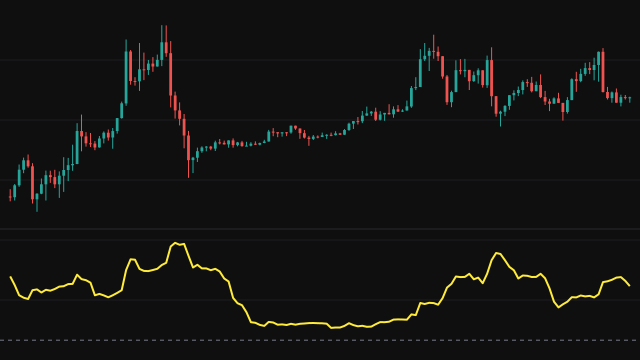
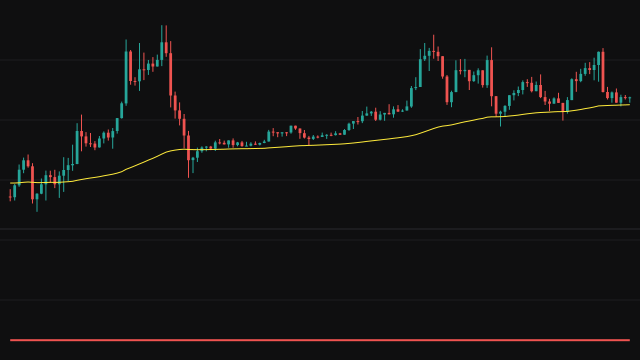
Pseudo-Huber Loss scores the gap between an actual series and a predicted series with a loss that behaves like a squared error for small misses and like an absolute error for large ones. On every bar the error is the actual value minus the predicted value. That error is divided by Delta, and the loss is Delta squared times the square root of one plus that ratio squared, minus one.
For an error much smaller than Delta the loss is close to half the squared error. For an error much larger than Delta it grows almost in a straight line, at about Delta times the absolute error, so a single large miss cannot dominate the reading the way it does in a squared error. The study plots the simple average of this loss over the last Length bars. An absent value on either side is read as zero.
How to read Pseudo-Huber Loss
A lower line means the predicted series has been tracking the actual one more closely. The line is in squared price units for small errors and in price units times Delta for large ones, so read it against its own history rather than as an absolute number. A rising line says the misses are getting larger; a spike that fades quickly is a short burst of large errors.
Delta sets where the loss changes character. Set it near the size of an ordinary miss on your chart: much smaller and almost every bar is in the linear zone, much larger and the loss acts like a plain squared error. The line has no value for the first Length minus one bars.
Settings
- Length
- How many bars the loss is averaged over. A longer window gives a smoother, slower line.
- Delta (transition scale)
- The error size where the loss turns from quadratic to roughly linear. Raise it to punish large misses more heavily.
- Actual
- The series treated as the truth.
- Predicted
- The series treated as the forecast that is scored against the actual one.
Frequently asked questions
How is this different from a plain squared error?
A squared error grows with the square of every miss, so one large miss can swamp the average. This loss grows only about linearly once the miss is larger than Delta, which keeps a single outlier from taking over.
What value of Delta should I use?
Pick something near the size of a normal miss in price units. With the default of 1 on an instrument that moves hundreds of points per bar, nearly every bar is in the linear zone and the line sits close to Delta times the mean absolute error.
Can the line go below zero?
No. The loss is zero only when the two series agree exactly and is positive otherwise, so the average is never negative.