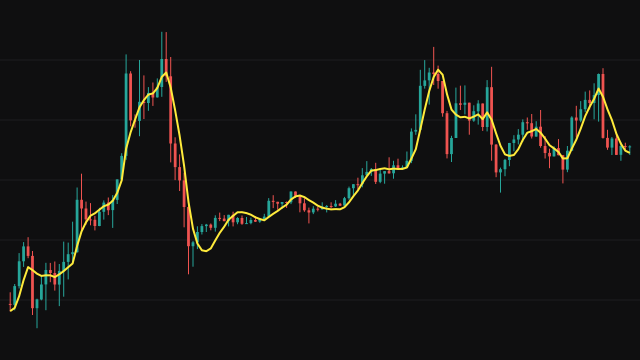
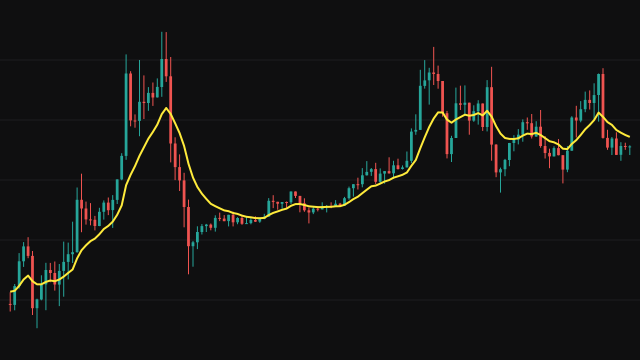
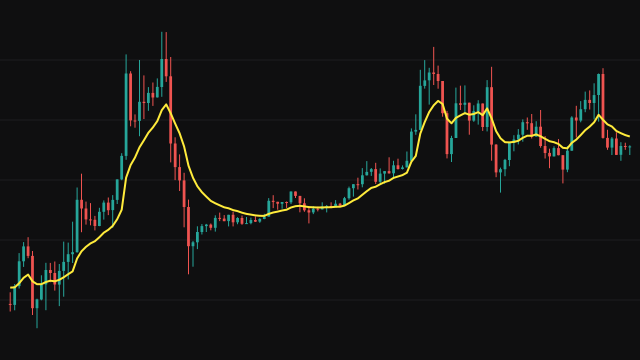
MMA starts from the simple average of the last period values. It then adds a correction that estimates where the line would be at the newest bar if the values in the window lay on a straight line. Walking the window from the newest value to the oldest, each value is weighted by (n - (2k + 1)) / 2, where n is the number of values and k is its position, so recent values get positive weight and older ones negative weight. The weighted sum times six, divided by n x (n + 1), is added to the mean.
The result is the end point of a least-squares straight line fitted through the window: it keeps the smoothness of the mean but sits much nearer the latest price. On the first bars the window holds fewer values and both parts use only those, so the line starts on the first bar.
How to read Modified Moving Average (MMA)
Read MMA as a low-lag trend line. In a steady trend it rides close to price instead of trailing behind it as a simple average does, so a turn in MMA appears sooner after a turn in price.
The correction projects the recent slope, so after a sharp move the line can overshoot price, and in a choppy market it changes direction more often than a simple average of the same length. Compare it with the plain SMA of the same period to see how much of the gap the correction closes.
Settings
- Period
- The number of bars in the window, from 2 to 4000. A longer window gives a smoother line.
- Source
- The price series that is averaged, the close by default.
Frequently asked questions
How is MMA related to a linear regression line?
The correction added to the mean is the slope of the window times half its span, so MMA equals the newest point of a least-squares straight line fitted through the window, just computed as a mean plus a correction.
Why can MMA move beyond price?
It extends the recent slope to the newest bar. After a fast move that then stalls, the projected slope carries the line past the latest price for a few bars.
Why does it draw from the first bar?
The mean and the correction both use however many values the window holds so far, so the first bar equals the source and the window grows to its full length.