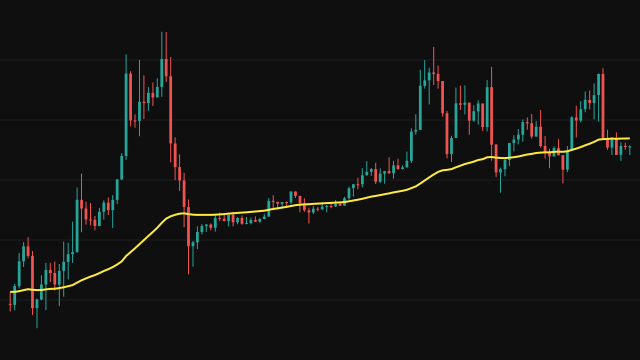
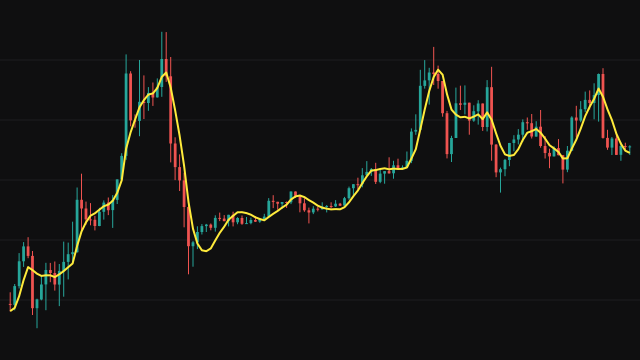
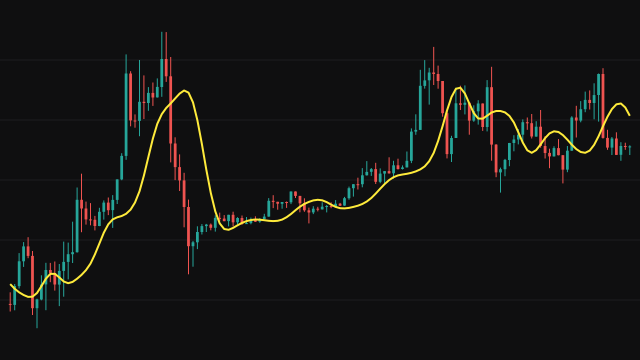
NMA works on the natural log of price, scaled by 1000. For each of the last period steps it takes the size of the move between neighbouring bars, then weights it with a square-root kernel: the newest step gets weight sqrt(1) - sqrt(0), the next sqrt(2) - sqrt(1), and so on, so weight falls off with age. The smoothing ratio is the weighted total divided by the plain total of the same moves.
When most of the movement in the window happened in the newest bars, the ratio is high and the line moves quickly toward price. When the movement is spread through the window or sits in older bars, the ratio is low and the line smooths hard. The average starts at the first source value and then steps toward the source by the ratio on each bar. Bars before the start of the chart read as zero, so the first few ratios are dominated by that first large step.
How to read NMA - Natural Moving Average
Read NMA as a trend line that changes speed on its own. During a fresh breakout, when the latest bars carry the movement, it catches up with price quickly; in a market that has gone quiet after earlier swings, it flattens and ignores small moves.
A rising line with price above it describes an uptrend and a falling line with price below it a downtrend. Give it a period's worth of bars before relying on it, because the earliest ratios are shaped by the start of the chart rather than by price behaviour.
Settings
- Period
- How many steps of log price are weighed to set the smoothing ratio. A longer period spreads the kernel and slows the line.
- Source
- The price series that is averaged, the close by default.
Frequently asked questions
Why does it use the log of price?
Log price turns moves into percentages, so the ratio responds to the relative size of moves and reads the same at any price level.
What makes the ratio high?
Movement concentrated in the newest bars. The square-root kernel gives the newest step the largest weight, so a big recent move against a quiet past pushes the ratio toward one.
Why do the first bars look different?
Bars before the start of the chart read as zero, so the first step is very large and dominates the ratio until enough real bars fill the window.