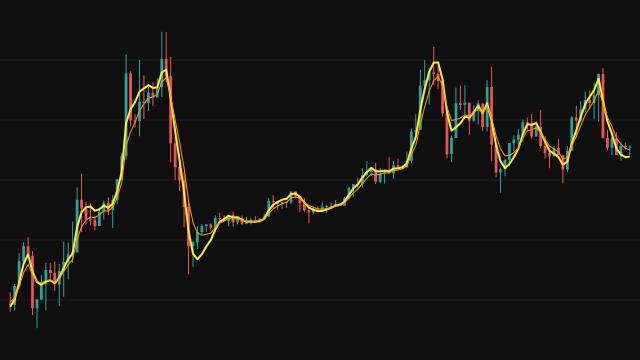
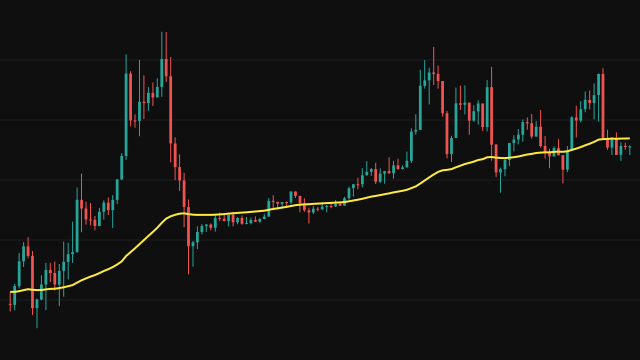
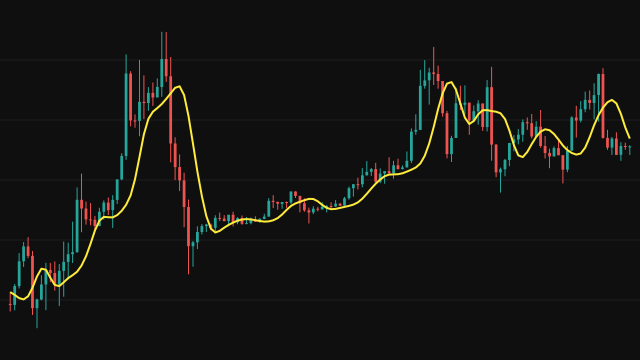
The Parzen Window Moving Average weights each bar of its window by a piecewise cubic curve. Each position in the window is mapped to u, running from -1 at the oldest bar to 1 at the newest. In the middle half the weight is 1 - 6u^2 + 6|u|^3, and toward the edges it is 2(1 - |u|)^3, which reaches zero smoothly at both ends. The weights are scaled to sum to one and multiplied into the source.
Because the weights fade to zero without a step at either edge, a bar entering or leaving the window barely moves the line. That keeps the average free of the small jumps a plain average shows. Until period bars exist the line shows the price itself, and a missing price counts as zero.
How to read Parzen Window Moving Average (PARZEN)
Read it as a smooth trend line. The weights are concentrated in the middle of the window, so the effective smoothing is narrower than the period and the line lags price by about half the window. A rising line with price above it describes an uptrend, and a falling line with price below it a downtrend.
Its strength is how cleanly it turns: short ripples are suppressed hard, so a change in slope is seldom noise. On the first bars, before a full window exists, it simply follows price.
Settings
- Source
- The price series that is averaged, the close by default.
- Period
- How many bars the cubic window spans. A longer period gives a smoother, slower line.
Frequently asked questions
Why does the window fade to zero at the edges?
A weight that drops to zero smoothly means a bar enters and leaves the average gradually. That removes the small steps a plain average makes when an old price drops out.
What does it show before the window is full?
The price itself. The weighted average begins once period bars exist.
How does it compare with a triangular average?
Both are symmetric and peak in the middle. The cubic shape here is rounder and fades out more gently, so it suppresses short ripples more strongly.