Note. Signal bars are shaded by counting whole chart intervals back from the chart clock rather than by counting bars, because a study cannot know on an earlier bar how many bars follow it, so on a market that closes, or when the clock is well past the newest bar, fewer bars are shaded; and the readout table sits in the nearest of four corners at the chart text size, because a table here has no centre positions and no size setting.
This setup is a five-filter momentum screen drawn on the price chart. A bar is flagged Long only when all five agree on strength: the percentage change from the close 250 bars back is above the threshold, RSI is above its overbought level, the Money Flow Index is above its overbought level, CCI is above its overbought level, and the bar's volume is larger than its exponential average multiplied by the volume multiplier. A Short needs the mirror image on every filter: the change below the negative threshold and each oscillator below its oversold level, again on a volume surge.
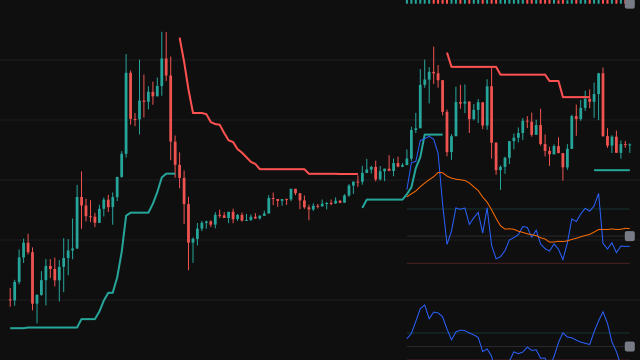
The percentage change is measured as the move over 250 bars divided by the current close. RSI is computed on the close, MFI on the typical price (high, low and close averaged) with volume, and CCI on the typical price. The volume average is an exponential average seeded with the simple average of its first values. A Supertrend line rides the price, drawn in green while the trend is up and in red while it is down, with the line breaking at each flip.
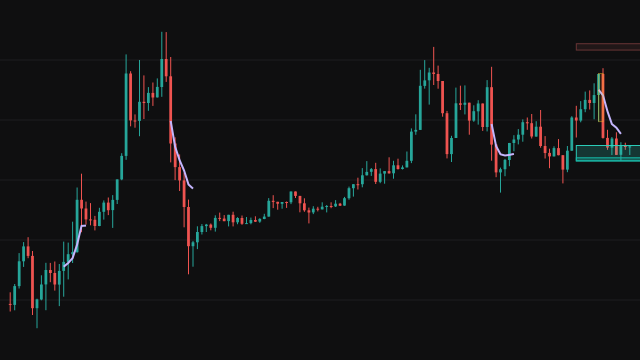
Over the most recent bars, set by Display Length, the study redraws RSI with its simple average, MFI, and CCI with its simple average as small curves in price space below the candles, each with its overbought, middle and oversold levels and a tag showing the latest reading. A volume histogram sits above the candles with the volume threshold (the average times the multiplier) running through it, and a tag giving the buying and selling share of the newest bar, its volume and that threshold. The histogram is drawn only when the newest bar carries volume. A small table in a corner lists the latest value of each filter, coloured green, red or grey by its verdict.
How to read Momentum Investing Setup with Scanner
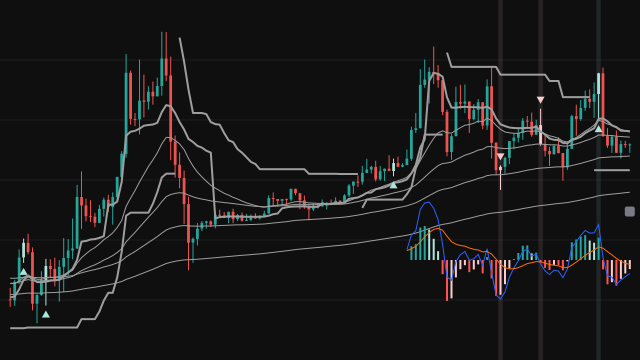
A Long triangle under a bar, with the candle recoloured light green, means price, momentum, money flow and volume all pointed up on that bar. A Short triangle above a bar, with a light red candle, is the same agreement to the downside. Signal bars near the newest bar, within roughly Display Length bars, are also shaded. The Supertrend line gives a trailing level to judge whether the move is holding.
The table shows which filters are already in place and which are missing, which is useful between signals. The volume filter is strict by design: with the multiplier at 5 a bar needs five times its average volume, so signals are rare and a chart can show none for a long stretch. The 250-bar change also means nothing can be flagged until 250 bars of history exist. The mini curves are rescaled to the recent price range, so read them for shape and position against their own levels, not for their price.
Settings
- Above/Below %
- The 250-bar percentage change a bar must exceed for a long signal, or fall below the negative of for a short signal. Lower it on intraday charts.
- RSI Display
- Draw the RSI curve, its average, its levels and its tag below the candles. The RSI filter still applies when this is off.
- RSI Length
- Bars in the RSI calculation. A longer length gives a smoother, slower reading.
- RSI SMA Length
- Bars in the simple average drawn with the RSI curve. It does not affect the signals.
- RSI Overbought
- The RSI level a long signal must be above, also drawn as the upper reference line.
- RSI Oversold
- The RSI level a short signal must be below, also drawn as the lower reference line.
- RSI Vertical Offset
- How far below the recent low the RSI curve sits, in multiples of the recent price range. Larger moves it further down.
- RSI Height
- How tall the RSI curve is drawn, as a multiple of the recent price range.
- MFI Display
- Draw the Money Flow Index curve, its levels and its tag below the candles. The MFI filter still applies when this is off.
- MFI Length
- Bars in the Money Flow Index window.
- MFI Overbought
- The MFI level a long signal must be above, also drawn as the upper reference line.
- MFI Oversold
- The MFI level a short signal must be below, also drawn as the lower reference line.
- MFI Vertical Offset
- How far below the recent low the MFI curve sits, in multiples of the recent price range.
- MFI Height
- How tall the MFI curve is drawn, as a multiple of the recent price range.
- CCI Display
- Draw the CCI curve, its average, its levels and its tag below the candles. The CCI filter still applies when this is off.
- CCI Length
- Bars in the Commodity Channel Index calculation on the typical price.
- CCI SMA Length
- Bars in the simple average drawn with the CCI curve. It does not affect the signals.
- CCI Overbought
- The CCI level a long signal must be above, also drawn as the upper reference line.
- CCI Oversold
- The CCI level a short signal must be below, also drawn as the lower reference line.
- CCI Vertical Offset
- How far below the recent low the CCI curve sits, in multiples of the recent price range.
- CCI Height
- How tall the CCI curve is drawn. CCI runs on a wider scale than RSI and MFI, so this is kept small.
- Display MA Line
- Draw the volume threshold (the exponential average times the multiplier) as a line through the volume histogram.
- Type
- Regular Volume colours each histogram bar by the candle direction; Buying/Selling Volume draws the whole bar in green with the selling share over it in red; None hides the histogram, its threshold line and its tag.
- MA Length
- Bars in the exponential volume average that the volume filter compares against.
- MA Multiplier (x)
- How many times its average the volume must be for a signal. 1 means any above-average bar qualifies; 5 asks for a strong surge.
- Volume Vertical Offset
- How far above the recent high the volume histogram starts, in multiples of the recent price range.
- Volume Height
- How tall the tallest histogram bar is drawn, as a multiple of the recent price range.
- Supertrend Display
- Show or hide the Supertrend line. The line plays no part in the signals.
- ATR Length
- Bars in the average true range that sets the Supertrend's distance from price.
- Factor
- Multiple of the average true range between price and the Supertrend line. Larger values flip less often.
- Display Length
- How many recent bars the mini curves and the volume histogram cover, and roughly how far back signal bars are shaded. The shading counts bar intervals back from the chart clock, so on a market with session breaks it covers fewer bars.
- Position
- Where the readout table sits. A table here can only sit in a corner: Top Left and Middle Left go to the top left, Bottom Left to the bottom left, Bottom Center and Bottom Right to the bottom right, and the other three to the top right.
- Size
- Kept with the other table settings, but a table here has no text size, so it does not change the drawing.
Frequently asked questions
Why are there no signals on my chart?
All five filters must agree on the same bar, and the volume filter asks for five times the average volume by default. That is rare on most instruments. Lower MA Multiplier (x) or the percentage threshold to see more signals, and remember that nothing can fire until 250 bars of history exist.
What do the curves below the candles show?
They are RSI, MFI and CCI redrawn in price space over the most recent bars, each with its overbought, middle and oversold lines. Their height is scaled to the recent price range, so the price axis does not read their values; the tag beside each curve gives the latest reading.
Does the Supertrend line affect the signals?
No. The signals come only from the five filters. Supertrend is drawn as a trailing level to judge whether a move is holding after a signal.
Is the percentage change measured from the old close?
No. The move over 250 bars is divided by the current close, not the close 250 bars back, so the figure is a little smaller than a plain rate of change after a large rise.