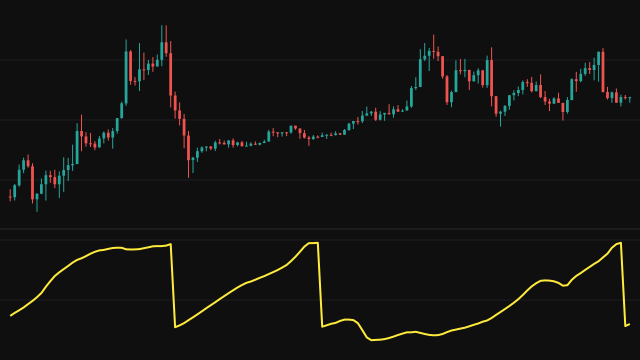
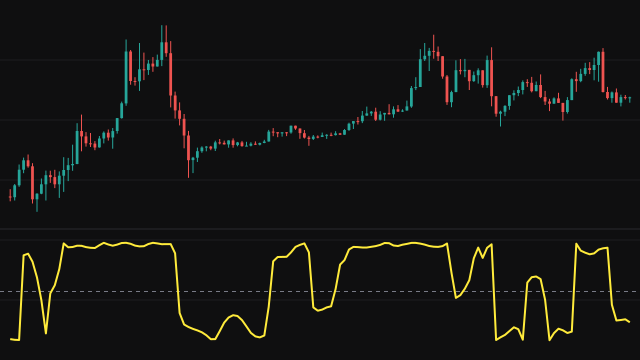
This study runs a small feed-forward neural network with six inputs, hidden layers of 8 and 4 nodes, and one output. The six inputs are price features, each squeezed into the range -1 to 1 with a hyperbolic tangent: a 20-bar weighted trend line against its 100-bar average, the 14-bar RSI divided by 100, the 14-bar ATR against its own 14-bar average, the close against its 20-bar average, the 10-bar momentum as a share of the close, and a 5-bar exponential average against a 20-bar one.
The weights start from a fixed, repeatable pattern and are trained on every bar by gradient descent, with a learning rate of 0.0025 that decays slowly over the run, a Huber loss and gradients capped at 5. The network reads the features as they stood five bars earlier and predicts a squeezed log return over the next five bars. That return is turned back into a price from the close five bars earlier, and the line is drawn on that earlier bar, so each point sits on the bar it was a prediction for.
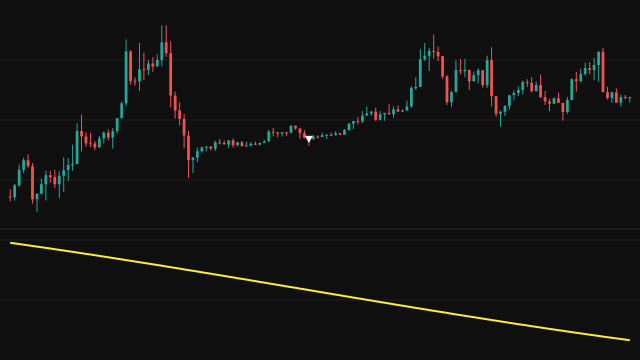
The training target is the log return measured once, over the first five bars the network sees, and it stays fixed for the rest of the run. Nothing is drawn until every feature has warmed up, which takes about 120 bars. On the newest bar a label shows the network's projection five bars ahead, run on the current features.
How to read Multilayer Perceptron Predictor
Treat the line as an experiment rather than a signal. Because each point is drawn on the bar it predicted from, you can see directly how far the network's guesses sat from the price that followed. The label on the newest bar shows the price the trained network projects five bars ahead.
The network is tiny, its training target is fixed after the first bars, and it learns only from this chart, so its output mostly follows recent price with a bias. Do not read the projection as a forecast to trade on; use it to study how a simple learning model behaves on this instrument.
Frequently asked questions
Why does the line start so late?
The slowest feature compares a 20-bar weighted trend line with its 100-bar average, so it needs about 120 bars. The network makes no prediction until all six features exist.
Why is the line drawn five bars back?
Each prediction is made from the features five bars earlier and is drawn on that bar, so the line can be compared against the price that actually arrived.
Can I change the network or its learning rate?
No. The layer sizes, learning rate, loss and feature set are fixed constants, so the study has no settings.