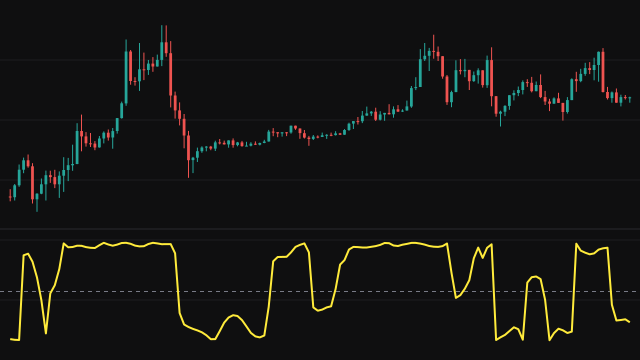
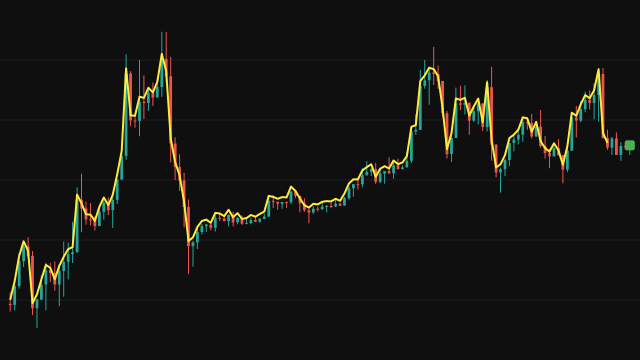
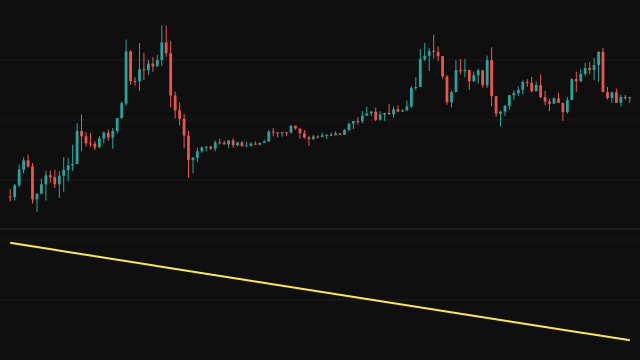
Phasor Analysis measures where price sits inside a cycle of a chosen length. Over the last Period bars it correlates price with one cycle of a cosine and one cycle of a negative sine. Bars before the first one count as zero, so the early window is zero padded. The two correlations are the real and imaginary parts of a phasor, and the study turns them into an angle in degrees.
The angle is unwrapped against the previous bar so it runs continuously instead of jumping a full turn, so it is not confined to -180 to +180 degrees. It also ratchets: a backward step is held at the previous value when the new angle is above -135 degrees and the previous one below 135, or when both are below -90. From the step between bars the study derives a cycle period, a full turn of 360 degrees over the step, reusing the previous period whenever the step stalls or runs backward and holding it between 1 and 60 bars. When the angle advances 6 degrees or less in a bar, the trend state reads +1 if the angle is at or beyond plus or minus 90 degrees and -1 if it is between them; otherwise it is 0.
How to read Ehlers Phasor Analysis (PHASOR)
In a market that is cycling, the Phasor Angle climbs steadily, and the speed of the climb sets the Derived Period. Because the angle is unwrapped, it can run to several hundred degrees and then drop back by close to a full turn when the unwrapping resets. When the angle stops advancing, the market has stopped cycling and is trending; the Trend State histogram marks those bars. The unwrapped angle usually sits beyond 90 degrees, so most of the marked bars read +1.
The derived period is noisy bar to bar and is clamped to 60 bars, so read it as a rough guide to the current rhythm rather than an exact count. The two optional plots are off by default.
Settings
- Period
- The length in bars of the reference cosine and sine, the cycle length the phasor is measured against.
- Source
- The price series correlated with the reference waves. The default is the close.
- Show Derived Period
- Draw the cycle period derived from how far the angle moved this bar, between 1 and 60 bars.
- Show Trend State Variable
- Draw the trend state histogram: +1 for a stalled angle at the extremes, -1 for a stalled angle in the middle, 0 otherwise.
Frequently asked questions
Why does the angle sometimes stay flat?
The angle ratchets. A backward step is held at the previous value when the new angle is above -135 degrees and the previous one below 135, or when both are below -90, so a market that is not cycling often shows a flat angle rather than one that wanders back.
Why is the derived period capped at 60?
A very small angle step would give an enormous period. The study holds the result between 1 and 60 bars so the plot stays readable.
What does a Trend State of -1 mean?
The angle advanced 6 degrees or less this bar while sitting between -90 and +90 degrees, which the study reads as a cycle mode rather than a trend. Because the angle is unwrapped and usually sits beyond 90 degrees, this reading is uncommon.