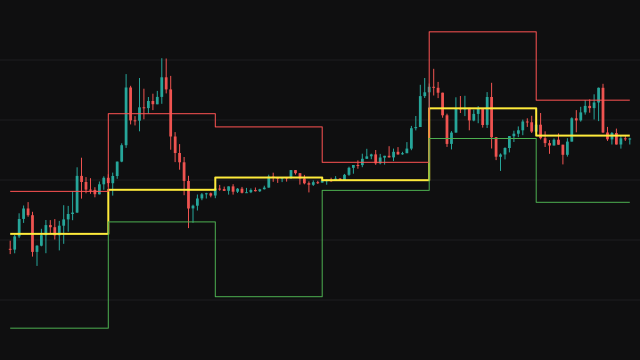
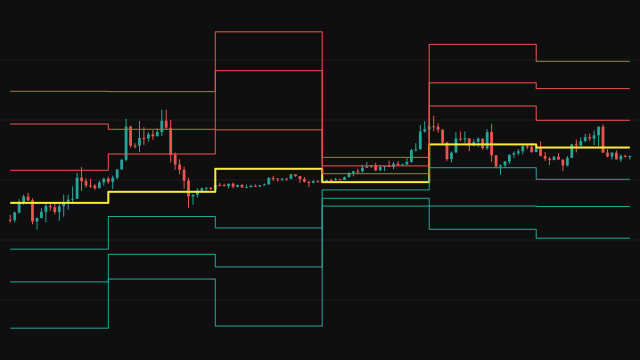
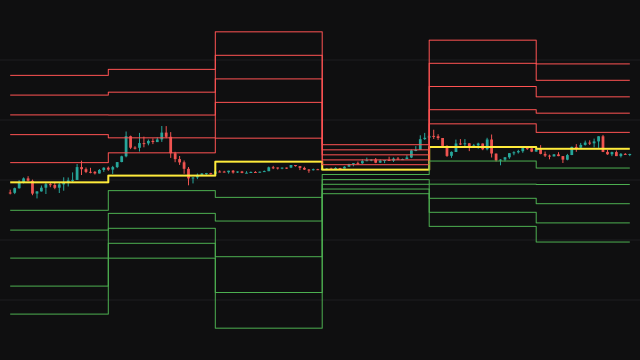
Camarilla pivots build their levels around the previous period's close rather than around a central pivot. Each level is the previous close plus or minus a fixed fraction of the previous period's range: the range times 1.0833, 1.1666, 1.25 and 1.5, each divided by 12, for levels one to four. That puts R1 and S1 about 9 percent of the range from the close and R4 and S4 one eighth of the range from it, so the levels are much tighter than classic pivots.
The study also draws the classic central pivot, the average of the previous high, low and close. The period can be a day, a Monday-start week or a calendar month. The chart's own bars are folded into those periods, and every bar of a period reads the high, low and close of the period before it, so the levels hold steady through each period.
How to read Pivot Points (Camarilla)
Because the levels sit close to the previous close, price reaches several of them in a normal period. A common reading treats R3 and S3 as the edges of the expected range, where traders look for price to turn back, and R4 and S4 as breakout levels, where a move beyond them suggests the range has given way.
The levels describe the previous period's range and close, nothing more. On a day that opens far from the previous close, most levels can be left behind at once, and the reading of turns and breakouts no longer applies.
Settings
- Pivot Timeframe
- The period the levels are built from: D uses the previous day, W the previous Monday-start week and M the previous calendar month. A longer period gives wider levels that stay in place for longer.
- Show Pivot Point
- Draw the central pivot line. Turning it off hides the line without changing any other level.
- Show R1
- Draw the first resistance level. Turning it off hides that line only.
- Show R2
- Draw the second resistance level. Turning it off hides that line only.
- Show R3
- Draw the third resistance level. Turning it off hides that line only.
- Show R4
- Draw the fourth resistance level. Turning it off hides that line only.
- Show S1
- Draw the first support level. Turning it off hides that line only.
- Show S2
- Draw the second support level. Turning it off hides that line only.
- Show S3
- Draw the third support level. Turning it off hides that line only.
- Show S4
- Draw the fourth support level. Turning it off hides that line only.
Frequently asked questions
Why are the levels centred on the close and not on the pivot?
That is how this method is defined: every support and resistance is the previous close plus or minus a fraction of the previous range. The central pivot line is drawn as well for reference, but no level is built from it.
Do the levels move during the day?
No. Every bar of a period reads the period before it, which has already closed, so the lines are fixed for the whole period and step to new values when the next one begins.
Why are there no levels at the start of the chart?
The levels come from the previous completed period. Until the chart holds one whole day, week or month of bars, there is no completed period to read, so the first period on the chart carries no lines.