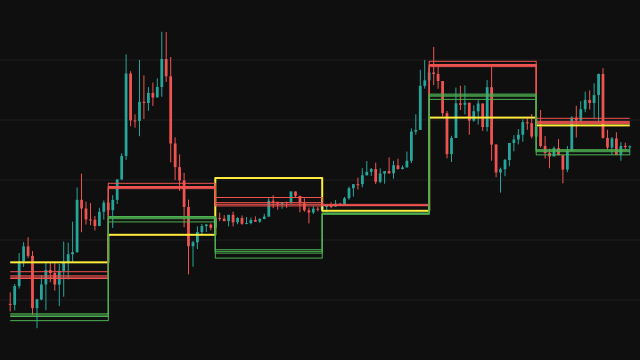
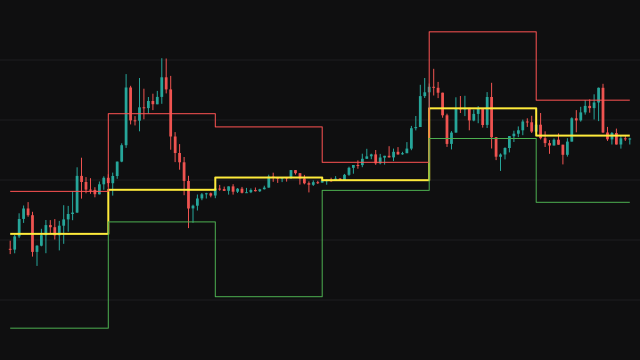
Classic pivot points turn the last completed period into a set of horizontal levels for the current one. The central pivot is the average of the previous period's high, low and close. The first resistance is twice the pivot less the previous low, and the first support is twice the pivot less the previous high. The second levels sit one full previous range above and below the pivot, and the third levels extend twice the distance between the pivot and the previous low or high beyond the previous high or low.
The period can be a day, a Monday-start week or a calendar month. The study folds the chart's own bars into those periods as it goes, keeps the high, low and close of the period being built, and on the first bar of a new period hands them over as the previous period. Every bar of a period therefore shows the same levels, drawn as steps.
How to read Pivot Points (Classic)
The pivot is the balance point of the previous period: price above it leans bullish for the period and price below it leans bearish. R1 to R3 above and S1 to S3 below are the levels traders watch for price to pause or turn, and once price breaks through one, the next level out becomes the following reference.
The levels are computed, not observed: they say where the previous period's range projects, not where orders actually sit. They are most useful on intraday charts with the daily setting, and on daily charts with the weekly or monthly setting.
Settings
- Pivot Timeframe
- The period the levels are built from: D uses the previous day, W the previous Monday-start week and M the previous calendar month. A longer period gives wider levels that stay in place for longer.
- Show Pivot Point
- Draw the central pivot line. Turning it off hides the line without changing any other level.
- Show R1
- Draw the first resistance level. Turning it off hides that line only.
- Show R2
- Draw the second resistance level. Turning it off hides that line only.
- Show R3
- Draw the third resistance level. Turning it off hides that line only.
- Show S1
- Draw the first support level. Turning it off hides that line only.
- Show S2
- Draw the second support level. Turning it off hides that line only.
- Show S3
- Draw the third support level. Turning it off hides that line only.
Frequently asked questions
Do the levels move during the day?
No. Every bar of a period reads the period before it, which has already closed, so the lines are fixed for the whole period and step to new values when the next one begins.
Why are there no levels at the start of the chart?
The levels come from the previous completed period. Until the chart holds one whole day, week or month of bars, there is no completed period to read, so the first period on the chart carries no lines.
How are R2 and S2 set?
They sit one full range of the previous period above and below the pivot, so a wide previous period spreads them apart and a quiet one pulls them close.