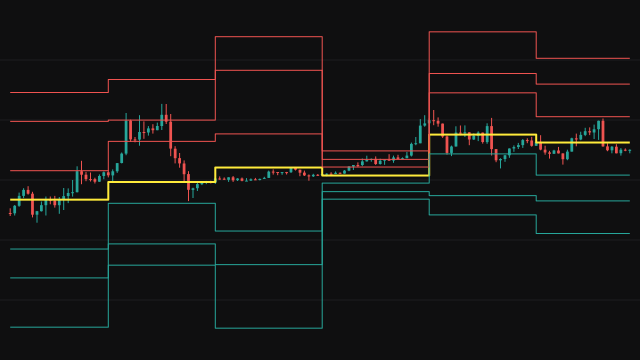
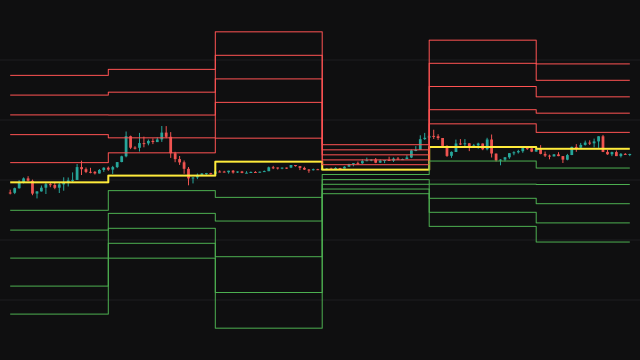
Fibonacci pivot points share the classic central pivot, the average of the previous period's high, low and close, but place the other levels by fixed fractions of the previous period's range. R1 and S1 sit 0.382 of the range above and below the pivot, R2 and S2 sit 0.618 of the range away, and R3 and S3 sit one full range away.
The period can be a day, a Monday-start week or a calendar month. The study folds the chart's own bars into those periods as it goes, and every bar of a period reads the high, low and close of the period before it. The result is a set of step lines that hold steady for each period and move when the next one starts.
How to read Pivot Points (Fibonacci)
The pivot is the reference: trading above it leans bullish and below it bearish for the period. The 38.2 and 61.8 percent levels are the levels traders watch for a pullback or an extension to stall, and the 100 percent levels mark a move as large as the whole previous range.
Because each distance is a fixed share of the previous range, a wide previous period spreads the levels out and a quiet one bunches them up. They describe the previous period only and carry no information about news or events in the current one.
Settings
- Pivot Timeframe
- The period the levels are built from: D uses the previous day, W the previous Monday-start week and M the previous calendar month. A longer period gives wider levels that stay in place for longer.
- Show Pivot Point
- Draw the central pivot line. Turning it off hides the line without changing any other level.
- Show R1 (38.2%)
- Draw the first resistance level. Turning it off hides that line only.
- Show R2 (61.8%)
- Draw the second resistance level. Turning it off hides that line only.
- Show R3 (100%)
- Draw the third resistance level. Turning it off hides that line only.
- Show S1 (38.2%)
- Draw the first support level. Turning it off hides that line only.
- Show S2 (61.8%)
- Draw the second support level. Turning it off hides that line only.
- Show S3 (100%)
- Draw the third support level. Turning it off hides that line only.
Frequently asked questions
What do the percentages in the labels mean?
Each level's distance from the pivot as a share of the previous period's range: 38.2 percent, 61.8 percent and the full range.
Do the levels move during the day?
No. Every bar of a period reads the period before it, which has already closed, so the lines are fixed for the whole period and step to new values when the next one begins.
Why are there no levels at the start of the chart?
The levels come from the previous completed period. Until the chart holds one whole day, week or month of bars, there is no completed period to read, so the first period on the chart carries no lines.