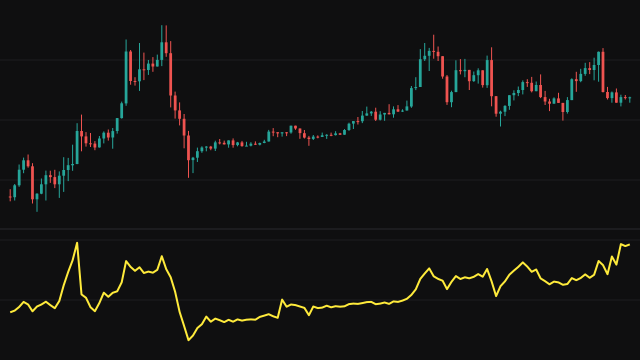
Price Volume Trend adds up volume, but only in proportion to how far price moved. On each bar the study takes the close's percentage change from the previous close and multiplies it by the bar's volume, then adds that to a total that starts at zero on the first bar. A bar that rises 1% on heavy volume adds a lot; a bar that barely moves adds almost nothing, whatever its volume.
This makes it a finer cousin of on-balance volume, which adds or subtracts the whole of each bar's volume by direction alone. The first bar compares its close with itself and adds nothing, and a bar without volume adds nothing.
A signal line, the simple moving average of the total over the chosen period, is drawn beside it. The pane is shaded green while the total is above its signal and red otherwise, including the warmup bars before the signal exists. A dashed zero line marks where the total started.
How to read Price Volume Trend (PVT)
Read the slope of the PVT line rather than its level, because the level depends entirely on where the chart begins. A rising line says volume has been arriving on up moves, which is accumulation; a falling line says it has been arriving on down moves. When price makes a new high and the PVT line does not, the move is being made on thinner participation.
The green and red shading shows whether the line is above or below its own average, a quick read of whether recent flow is stronger or weaker than usual. Crossings of the signal line come often in a sideways market, so treat them as context rather than as entries on their own.
Settings
- Signal Line Period
- The number of bars in the simple moving average drawn as the signal line. A longer period gives a slower signal that the PVT line crosses less often.
Frequently asked questions
How is it different from on-balance volume?
On-balance volume adds or subtracts the whole of a bar's volume according to the direction of the close. PVT scales the volume by the size of the percentage move, so small moves count for little and large moves count for a lot.
Why is the background red at the start of the chart?
The signal line needs a full window of bars before it exists. Until then the line cannot be above its signal, so those bars are shaded red.
Does the absolute value of PVT mean anything?
Not on its own. The total starts at zero on the first bar of the chart, so its level shifts with the history loaded. Compare its direction and its swings with those of price instead.