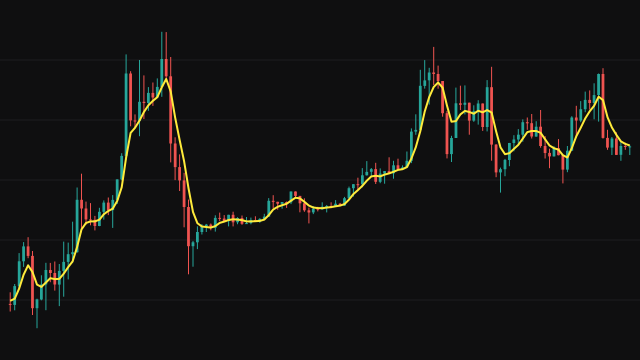
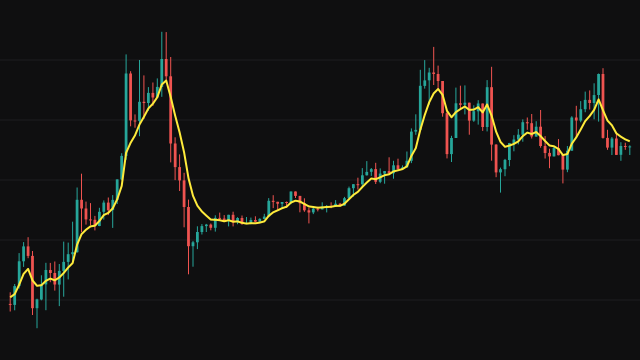
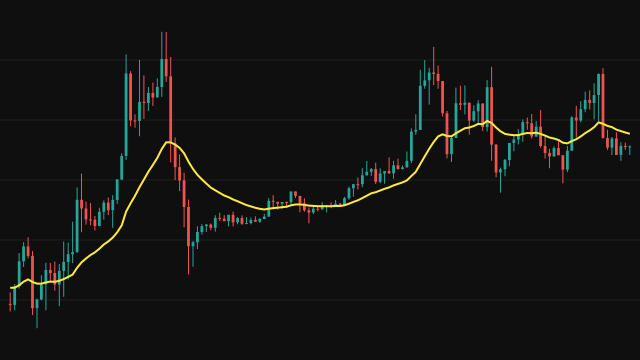
The Quadratic Regression Moving Average fits the curve y = a + b x + c x^2 to the source over the last period bars, with x = 0 at the oldest bar of the window and x = period - 1 at the newest. The fit is ordinary least squares: the three normal equations are solved with Cramer's rule, using sums of x up to the fourth power that depend only on the period.
The value plotted is the fitted curve at the newest bar. A straight-line fit can only follow a slope; adding the squared term lets the line bend with a move that is speeding up or slowing down. Until period bars exist the line shows the price itself, and a missing price counts as zero.
How to read Quadratic Regression Moving Average (QRMA)
Read it as a fast trend line. Because it fits curvature, it stays close to price through accelerating moves and turns sooner than a simple or linear average of the same length. Price above a rising line describes an uptrend, and below a falling line a downtrend.
The same flexibility is its limit: at the end of the window a parabola can overshoot, so after a sharp reversal the line may briefly run past price. Shorter periods make it react faster and more nervously; longer ones steady it.
Settings
- Period
- How many bars the parabola is fitted to. At least 3, since a parabola needs three points.
- Source
- The price series the curve is fitted to, the close by default.
Frequently asked questions
How is it different from a linear regression average?
A linear fit draws a straight line through the window, so it lags whenever the move curves. The quadratic fit adds a bend and keeps up with a move that is accelerating or fading.
Why can it overshoot price?
The parabola is read at the very end of the window, where a curve fitted to the past is least constrained. After a sharp turn it can extend the old curvature for a few bars.
Why must the period be at least 3?
A parabola has three unknowns, so it needs at least three bars to be fitted.