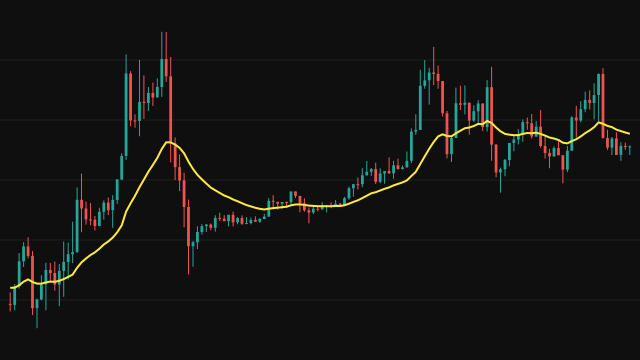
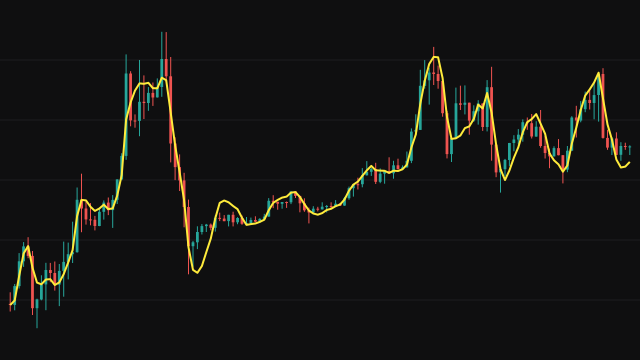
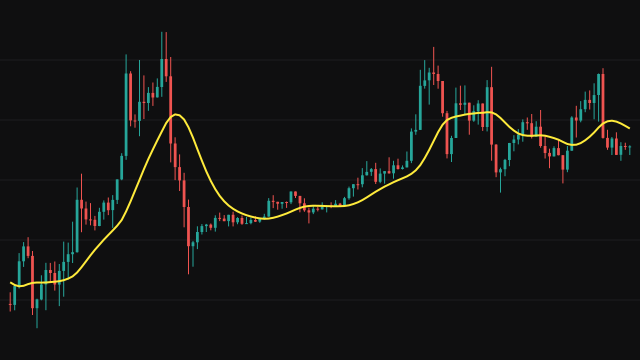
The Rainbow Moving Average smooths the source ten times in a row. Layer one is a simple average of the source over period bars, layer two is the same average of layer one, and so on up to layer ten. Each layer is smoother and slower than the one below it.
The ten layers are then blended into a single line with weights 5, 4, 3 and 2 for the first four layers and 1 for each of the other six, and the total is divided by 20. The faster layers carry most of the weight, so the result is smooth without being as slow as the tenth layer. Every layer averages the bars seen so far until its window is full, so the line starts on the first bar, and a missing price counts as zero.
How to read Rainbow Moving Average (RAIN)
Read it as a smooth trend line built from a whole family of averages. With the default period of 2 it sits close to price but filters out single-bar noise; larger periods make each layer slower and the blend much smoother. Price above a rising line describes an uptrend, and below a falling line a downtrend.
Because it mixes ten layers of different speeds, its lag is longer than one simple average of the same period. Keep the period small unless you want only the broad swing.
Settings
- Period
- The window of each of the ten stacked averages. Small values already smooth a lot, because the averaging is repeated ten times.
- Source
- The price series the first layer averages, the close by default.
Frequently asked questions
Why is the default period only 2?
The averaging is applied ten times, so even a 2-bar window ends up smoothing over many bars. A period of 10 or more makes the blend very slow.
Why are the first layers weighted more?
The early layers follow price closely and the later ones lag. Weighting the early ones more keeps the line smooth while limiting the lag.
Where are the ten layers?
This study draws only the blended line. The layers are computed and combined, not plotted.