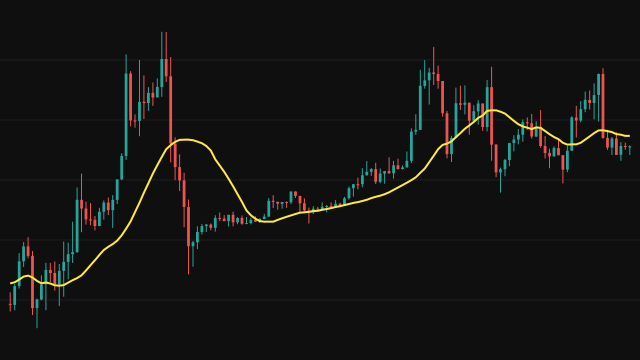
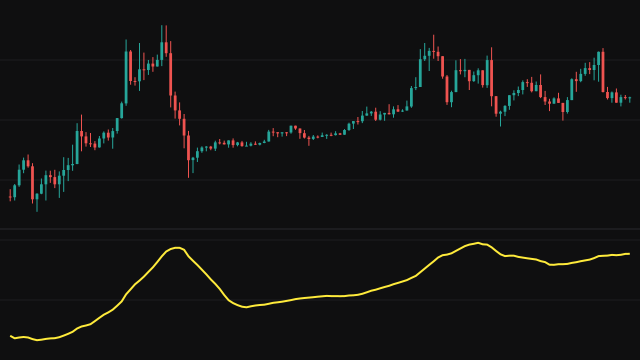
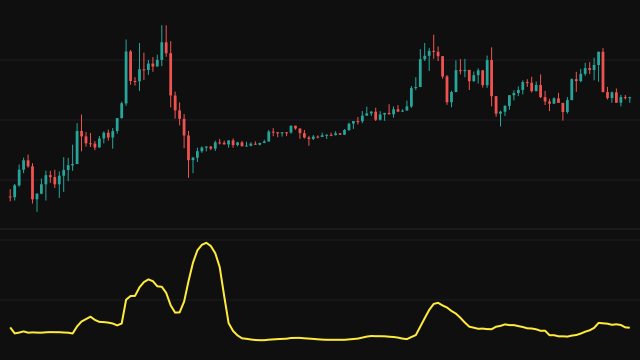
The Theil index is an entropy measure of inequality. Over the lookback window it takes the mean of the positive values, divides each value by that mean to get a ratio, and averages ratio * ln(ratio) across the window. When every value equals the mean, each ratio is 1, its logarithm is 0, and the index is 0. The further the window is from even, the higher the reading.
Only values above zero take part: a value that is absent, zero or negative is left out of both the mean and the count, which is why the source must be positive. The window grows from the first bar until it holds the full lookback, so the line answers from the start of the chart. On price, which moves only a small fraction of its level within a window, the readings are small numbers; on volume they are much larger, because volume is far less even from bar to bar.
How to read Theil Index (THEIL)
Read the line as a measure of how lopsided the recent values are. A reading near zero means the window is calm and every value sits close to the average. A rise means a few values have pulled away from the rest, for example a sharp move in price or a burst of volume on one or two bars. A falling line means the window is evening out again.
The index has no direction: a spike up and a spike down both raise it. Multiplying the whole series by a constant leaves it unchanged, but it depends on how much the series varies relative to its own level, so compare readings on the same source and lookback.
Settings
- Source (must be positive values)
- The series whose spread is measured. Values at or below zero are skipped, so use a positive series such as a price or volume.
- Lookback Period
- How many bars the window holds. A longer window reacts more slowly and averages out single spikes.
Frequently asked questions
Why is the reading so small on price?
Within a few bars price rarely moves more than a percent or two from its own average, so every ratio is close to 1 and ratio * ln(ratio) is tiny. The index is more expressive on uneven series such as volume.
What happens to zero or negative values?
They are skipped. The mean and the final average are taken over the positive values only, so a window with no positive value draws nothing.
Does a high reading mean price is going up?
No. The index measures unevenness, not direction. A sharp fall raises it just as a sharp rise does.