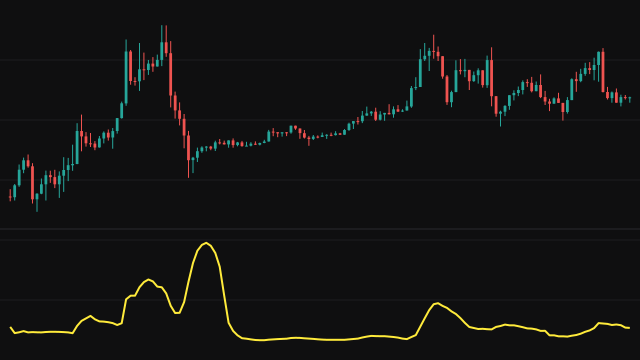
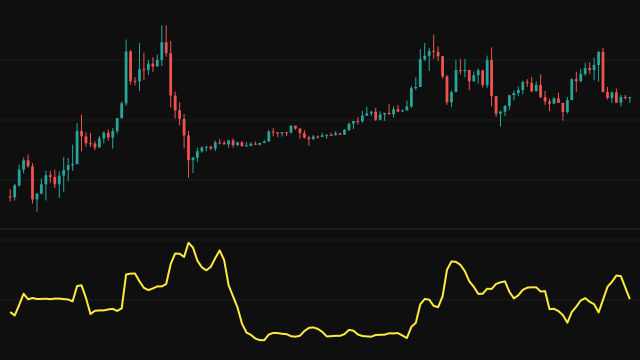
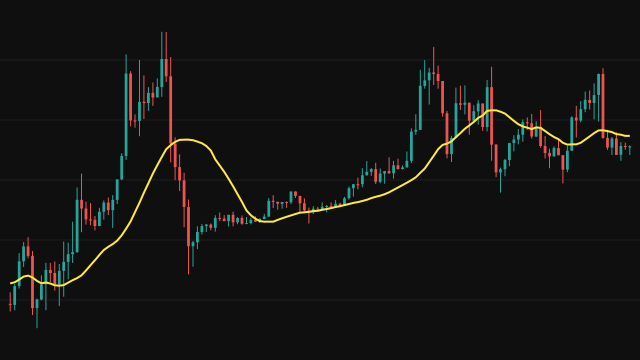
The Rolling Sum study adds up the last Length values of the source. It keeps a running total, adding each new value as it arrives and subtracting the value that leaves the window, rather than adding the whole window again on every bar.
A running total built from many additions and subtractions slowly gathers rounding error. To stop that, the study carries two compensation terms that hold the part of each step lost to rounding and feed it back into the next one, a second-order compensated summation. The result stays accurate over thousands of bars.
The study answers from the first bar: before the window is full, the value is the total of however many values exist so far. An absent value counts as zero.
How to read Rolling Sum
On a price source the rolling sum is the moving average multiplied by the length, so it has the same shape at a larger scale; its main use is as a building block, or on a series where the total itself means something. The Source menu offers only price series, so totalling volume or a series of changes means editing the script to sum that series instead.
The first Length bars climb steeply because the window is still filling, so ignore that stretch when reading the level.
Settings
- Length
- How many recent values are added together.
- Source
- The price series being totalled, such as the close or the bar midpoint.
Frequently asked questions
Why does the line rise steeply at the start?
Before the window is full the study totals however many values exist, so each early bar adds a value without removing one.
What does the error compensation do?
Adding and subtracting values over a long history leaves small rounding errors in the total. The study keeps track of what was lost on each step and adds it back, so the total stays within rounding of a fresh sum of the window.
How is it related to a simple moving average?
Once the window is full, the rolling sum divided by the length is the simple moving average of the same values.