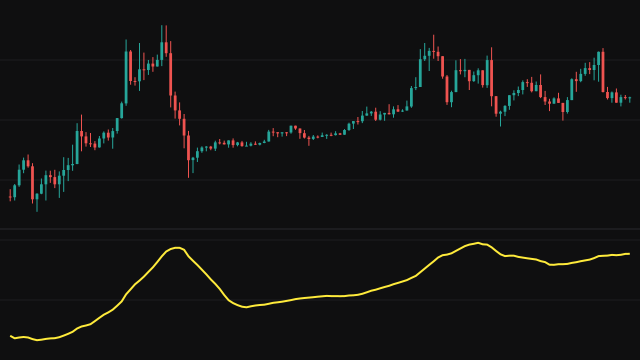
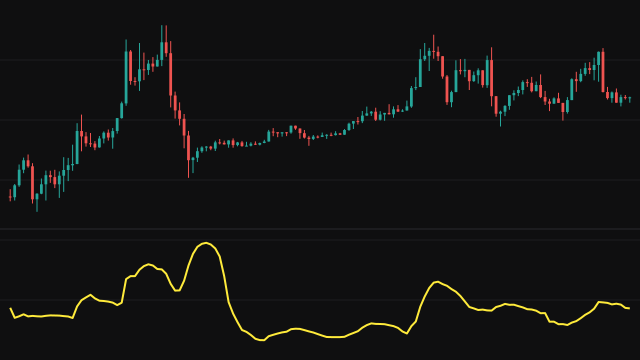
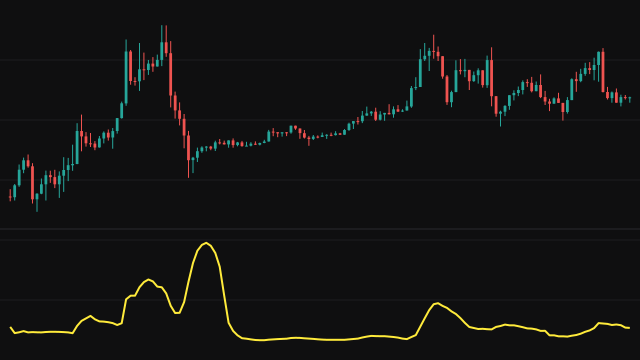
The study fits a straight line by least squares through the last Period values of the source, with the oldest value at x = 0 and the newest at the far end. It then measures each value's vertical distance from that line, squares the distances, adds them up, divides by the number of values minus two, and takes the square root. That is the standard error of the regression, the typical size of a residual around the fitted trend.
Until the window is full the regression runs over the values that exist, starting once there are at least three. An absent value counts as zero. The result is in the same units as the source.
How to read Standard Error of Regression (STDERR)
A low reading means price has been moving close to a straight line, an orderly trend or a quiet range. A high reading means it has been scattering away from its own trend, either because the trend is bending or because the market is choppy. A sharp rise after a calm stretch means price has moved away from the line it was tracking.
The standard error says nothing about direction or slope: a steep clean trend and a flat quiet range can read the same. Pair it with a regression line or a slope measure to see which way the trend runs.
Settings
- Period
- How many recent values the line is fitted through, at least 3. A longer period gives a steadier reading.
- Source
- The series the line is fitted to, the close by default.
Frequently asked questions
How is it different from the standard deviation?
The standard deviation measures spread around the mean, so a clean trend reads high. The standard error measures spread around the trend line, so a clean trend reads low.
Why divide by the period minus two?
Fitting a line uses up two degrees of freedom, its slope and its intercept, so the residuals are averaged over n - 2 rather than n.
Why are the first two bars blank?
A line through two points fits them exactly and has no residual to measure, so the study starts once the window holds three values.