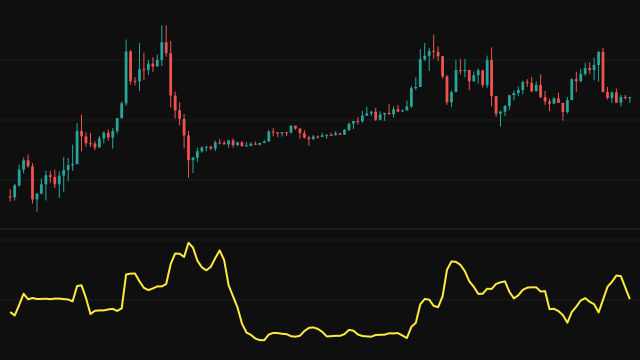
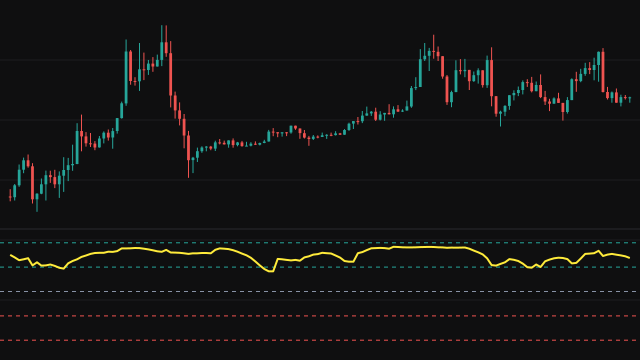
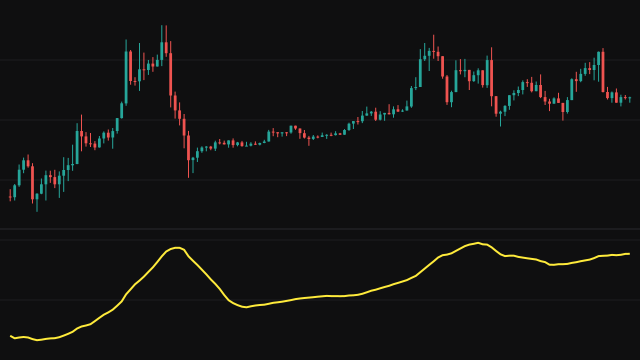
The study measures the spread of the last Period values of the source around their mean. It keeps a running sum and a running sum of squares, removing the value that leaves the window before adding the new one, and computes the population standard deviation as the square root of the mean of the squares minus the square of the mean.
There is no warmup gap: until the window is full the deviation is taken over the values that exist, and a single value has a deviation of 0. An absent value counts as zero. Because it divides by the number of values rather than one less, this is the population form, slightly smaller than the sample form on a short window.
How to read Standard Deviation (STDDEV)
A rising line means recent values are spreading further from their mean, which is what volatility expansion looks like; a falling line means they are bunching together. A long stretch of low readings marks a quiet market; it says nothing about when the next larger move comes or which way it goes.
The value is in the same units as the source, so on price it is a distance in price. That makes it useful for sizing stops or bands, but it also means readings from instruments at very different prices are not comparable without scaling.
Settings
- Period
- How many recent values the deviation is taken over. A longer period gives a smoother, slower line.
- Source
- The series whose spread is measured, the close by default.
Frequently asked questions
Is this the population or the sample standard deviation?
The population form: it divides by the number of values, not by one less. On a long window the two are almost the same.
Why does it start at zero?
On the first bar there is only one value, and one value has no spread. After that the deviation is taken over the bars that exist until the window is full.
How is it used in bands?
Adding and subtracting a multiple of the standard deviation from a moving average gives volatility bands that widen in active markets and narrow in quiet ones.