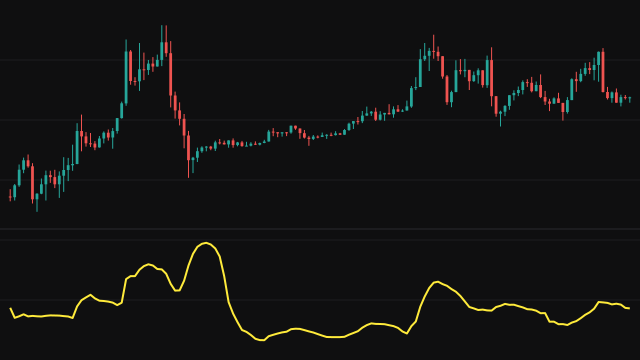
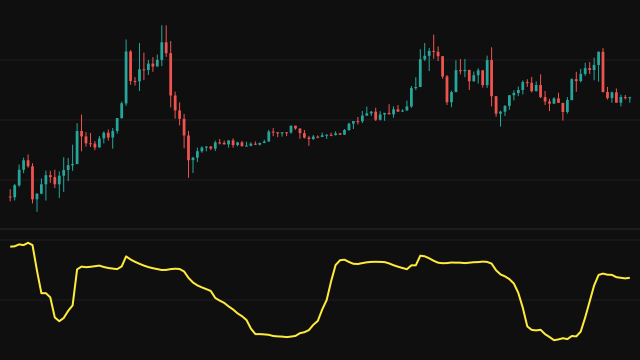
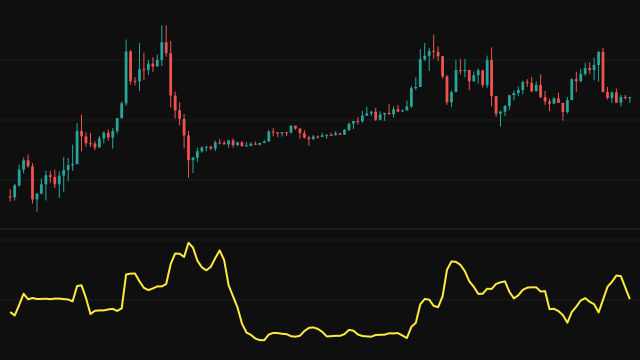
Spearman's rank correlation replaces each value in the window by its rank, then measures the Pearson correlation between the two rank series. Each value's rank is the count of smaller values in its window, plus half the number of other values equal to it, plus one, so tied values share the average of their ranks.
Because only order matters, the result is unmoved by outliers and by any rescaling that keeps the order of the values. It reads +1 when the two series rise and fall in perfect step, -1 when one rises exactly as the other falls, and 0 when their orderings are unrelated. When either series is flat over the window the study reads 0.
Both series come from the chart's own symbol, the close and the open by default. The study needs a full window of Lookback Period bars, and a bar is left blank when any value in the window is absent.
How to read Spearman Rank Correlation (SPEARMAN)
With the default inputs, a reading near +1 means the closes and opens have been ranked the same way, which happens in a steady trend; readings that fall toward zero show the two drifting apart within the window. The dashed lines at plus and minus 0.5 mark a moderate relationship, and the solid lines at plus and minus 1 are the bounds.
Rank correlation is less sensitive to a single extreme bar than Pearson correlation, but over a short window it still moves a lot by chance. The lookback is capped at 60 bars.
Settings
- Source 1
- The first series of the pair, the close by default.
- Source 2
- The second series of the pair, from the same symbol. It defaults to the open because a series compared with itself always reads +1.
- Lookback Period
- How many bars are ranked, from 2 to 60. A longer period gives a steadier reading.
Frequently asked questions
How does it differ from Pearson correlation?
Pearson correlation uses the values themselves and measures a straight-line relationship, so one extreme bar can dominate it. Spearman uses only the order of the values, so it measures whether the two series rise and fall together in any steady way.
Why is the lookback capped at 60?
Ranking compares every value in the window with every other, so the work grows with the square of the window. The cap keeps the study fast.
Why does it default to close against open?
Both series come from the chart's own symbol, and comparing a series with itself reads +1 on every bar. The open is a different series of the same instrument.