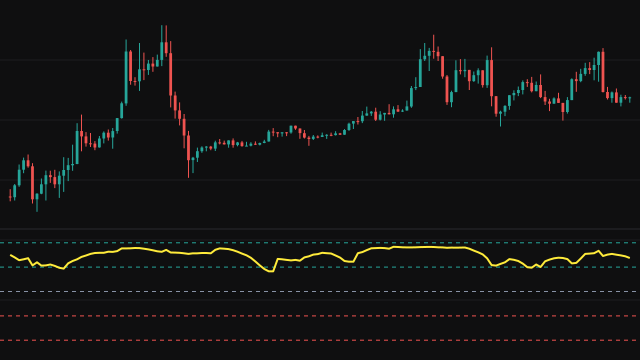
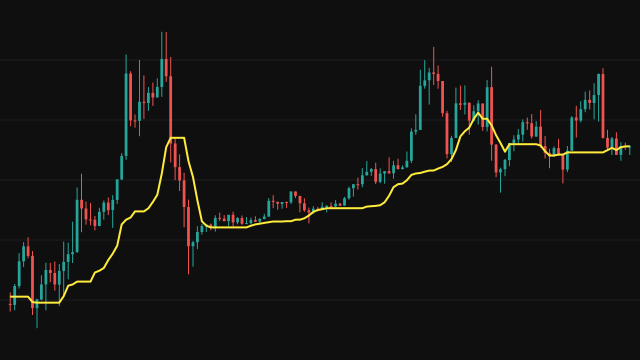
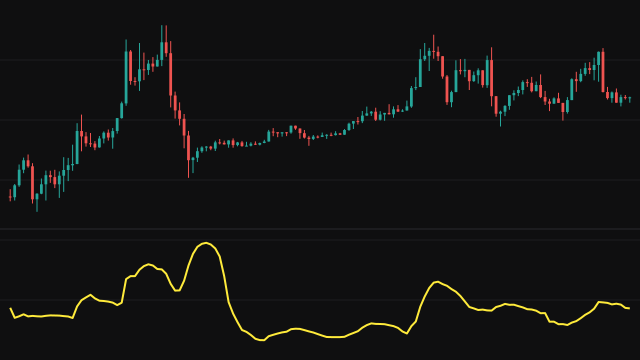
Skewness describes the asymmetry of a distribution. This study estimates it over the last Length bars as the third moment about the mean divided by the cube of the standard deviation.
It does so with a fixed amount of work per bar. It keeps a rolling mean of the source, measures each bar's deviation from the mean as it stood on that bar, and keeps rolling sums of the squared and cubed deviations. The window is never re-centred on the latest mean, so the result is an approximation of the textbook skewness rather than an exact recomputation of the window. Until the window is full, the means are taken over the bars that exist.
When the standard deviation is effectively zero the study reads 0, and an absent value counts as zero.
How to read Skewness (SKEW)
A positive reading means the recent values have a longer tail above the mean: most bars sat a little below it, with a few large values above. A negative reading means the reverse, a few sharp drops among many small gains. A reading near zero means the recent values are roughly symmetric.
On raw price, the only kind of series the Source menu offers, the reading mostly reflects the shape of the recent trend; persistent negative skew in a returns series, which needs a small edit to the script, points to occasional large drops. The measure is sensitive to a single extreme bar, so a spike can swing it sharply until that bar leaves the window.
Settings
- Source
- The price series whose asymmetry is measured.
- Length
- How many recent bars the moments are taken over, at least 3. A longer length gives a steadier reading.
Frequently asked questions
Is this exactly the textbook skewness?
Close but not exact. Each deviation is measured against the mean on its own bar, and the window is not re-centred on the latest mean, which keeps the work per bar fixed at the cost of an approximation.
Why does one bar change it so much?
Skewness uses cubed deviations, so a single large move dominates the sum until it leaves the window.
What does a reading of 0 mean?
Either the recent values are balanced about their mean, or the window was flat and the standard deviation was effectively zero, in which case the study also reads 0.