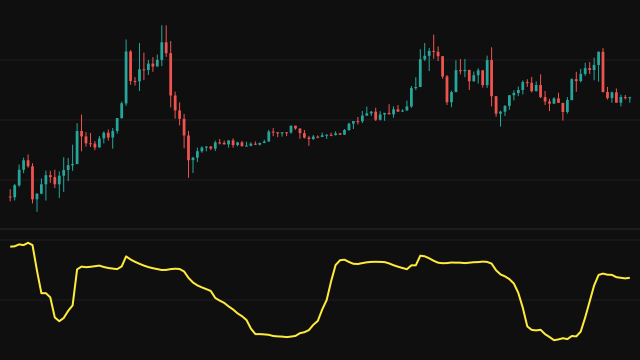
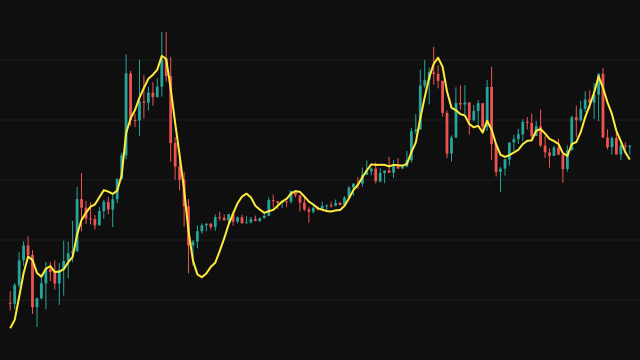
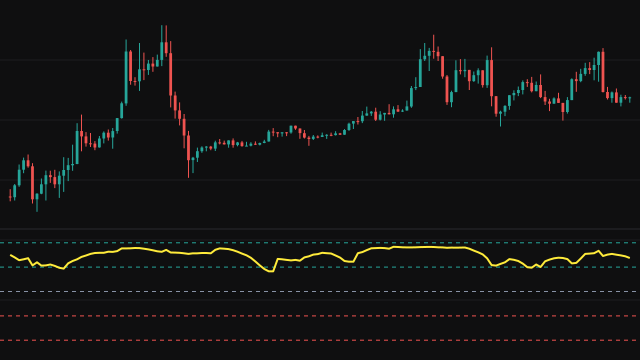
The Quantile study sorts the last Period values of the source and plots the value at the requested quantile level. The rank is the level times one less than the number of values, and when it falls between two positions the study interpolates linearly between the neighbouring values.
A level of 0.5 gives the rolling median, 0 the lowest value in the window and 1 the highest. The default of 0.25 is the lower quartile, the level a quarter of the recent bars sit below.
The window at the left edge of the chart is ranked over the bars that exist, so the study answers from the first bar, and absent values are skipped.
How to read Quantile (QUANTILE)
Use a low level as a robust floor and a high level as a robust ceiling for the recent range. Unlike the highest and lowest values of the window, a quantile is not set by a single extreme bar, so a one-off spike does not shift it.
Price holding above the lower quartile shows the recent distribution being respected, and a value below it is lower than roughly three quarters of the recent values. The line trails a fast move, as any rolling statistic does.
Settings
- Source
- The price series whose values are ranked.
- Period
- How many recent bars are ranked. A longer period gives a steadier level.
- Quantile Level (0.0-1.0)
- Which quantile to draw, from 0 for the window low to 1 for the window high; 0.5 is the median.
Frequently asked questions
How does this differ from the Percentile study?
They compute the same thing on different scales: a quantile level of 0.25 is the 25th percentile. This study takes the level as a fraction from 0 to 1.
Why use a quantile instead of the window low?
The window low is set by one bar, so a single spike moves it. A quantile such as 0.1 ignores the most extreme few bars and gives a steadier level.
Does it wait for a full window?
No. Until the window fills it ranks the bars that exist, so the line starts on the first bar.