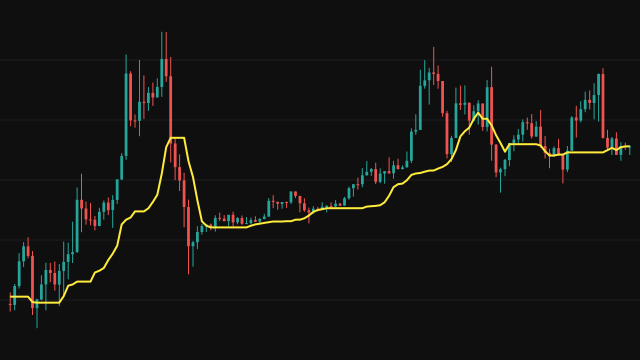
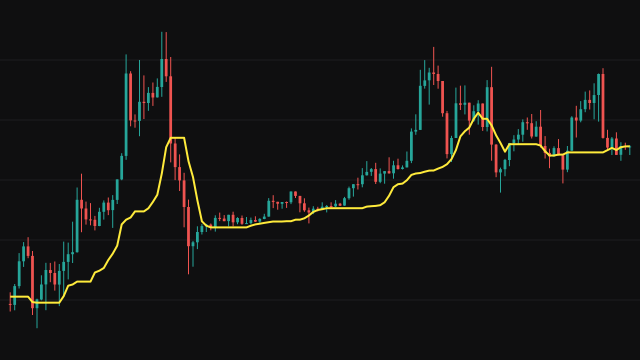
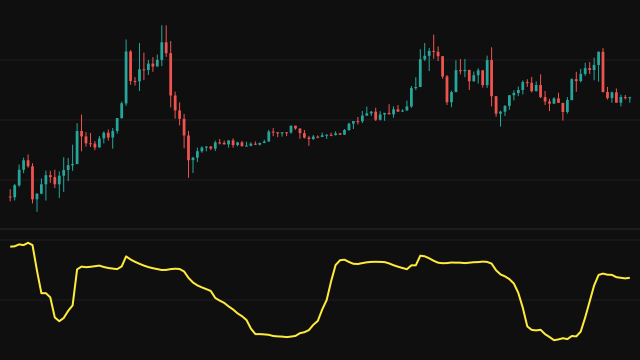
The study takes the last Period values of the source, spreads them evenly over x from 0 at the oldest to 1 at the newest, and fits a polynomial of the chosen degree to them by least squares. It builds the normal equations from summed powers of x and solves them by Gauss-Jordan elimination with partial pivoting. The plotted value is the fitted curve evaluated at the newest bar, which on this scale is simply the sum of the coefficients.
Degree 1 is a straight line, so the study then gives the end point of a linear regression. Degree 2 lets the line bend, and higher degrees follow the window more closely. The degree is capped at one less than the period. An absent source value repeats the last value that was present, and the study starts once the window holds at least two more values than the degree.
How to read Polynomial Fitting (POLYFIT)
Read the line as a smoothed estimate of where price is now, given the shape of the recent window. A low degree gives a calm line that lags turns; a higher degree hugs price more closely and turns sooner, but it also reacts more to noise near the end of the window, where a polynomial fit is least stable.
The value at each bar comes from its own fit, so the curve drawn across the chart joins many separate end points rather than one fitted curve. Degree 2 with a moderate period is a reasonable middle ground.
Settings
- Period
- How many recent values each fit uses. A longer period gives a smoother, slower line.
- Degree
- The polynomial degree: 1 for a straight line, 2 for a curve with one bend, up to 6.
- Source
- The price series the polynomial is fitted to.
Frequently asked questions
Is degree 1 the same as a linear regression line?
Yes. With degree 1 the study fits a straight line to the window and plots its value at the newest bar, the end point of a linear regression.
Should I use a high degree?
Rarely. A high degree follows the window closely but swings at its ends, and the newest bar is an end, so the line becomes jumpy. Degrees 1 to 3 are the usual choices.
Why does the line start a few bars in?
A fit of degree d needs at least d + 2 values in the window before the study draws it, so the first few bars have no value.