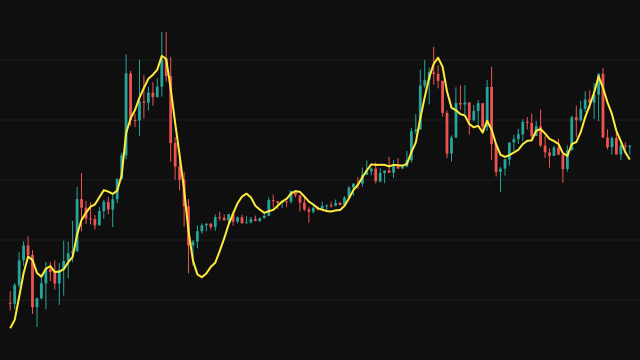
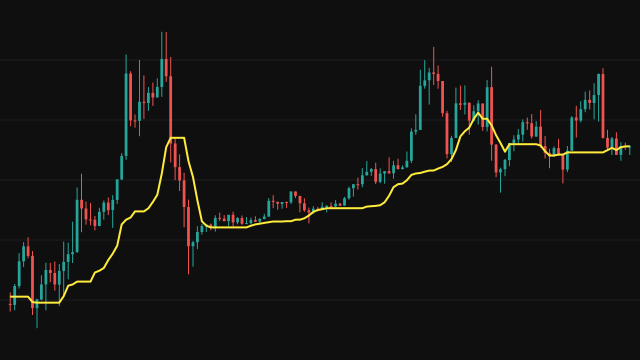
The Percentile study sorts the last Period values of the source and plots the value at the chosen percentile. The rank is the percentile as a fraction times one less than the number of values, and when that rank falls between two positions the study interpolates linearly between the two neighbouring values.
A percentile of 50 gives the median, 0 gives the lowest value in the window and 100 the highest. The default of 25 traces the lower quartile, a level that about a quarter of the recent source values sit below.
The study answers from the first bar, ranking however many bars exist until the window fills, and it skips absent values.
How to read Percentile
Read the line as a floor or ceiling drawn from the distribution of recent prices rather than from a single extreme. A low percentile marks where price has rarely traded in the window, and a close below it is unusual for the period. A high percentile does the same for the top.
Two copies of the study, one at a low and one at a high percentile, make a band that ignores single outlier bars, unlike a channel built from the window's highest and lowest values. Like any rolling statistic it trails a fast move.
Settings
- Source
- The price series whose values are ranked.
- Period
- How many recent bars are ranked. A longer period gives a steadier level.
- percentile
- Which percentile to draw, from 0 for the window low to 100 for the window high; 50 is the median.
Frequently asked questions
How is it different from the window's lowest value?
The lowest value is set by a single bar. A low percentile such as 10 or 25 ignores the few most extreme bars, so one spike does not move it.
Why is the setting labelled in lower case?
The setting is stored under the name percentile, which is also the name of a built-in function, so its label carries that name directly. It still accepts any value from 0 to 100.
What does interpolation change?
When the chosen percentile falls between two ranked values, the line sits proportionally between them instead of jumping from one to the other, so it moves more smoothly.