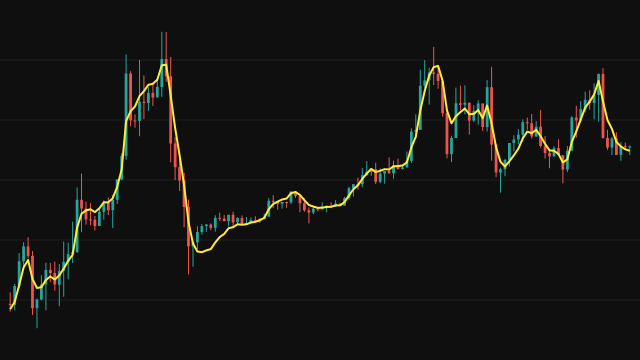
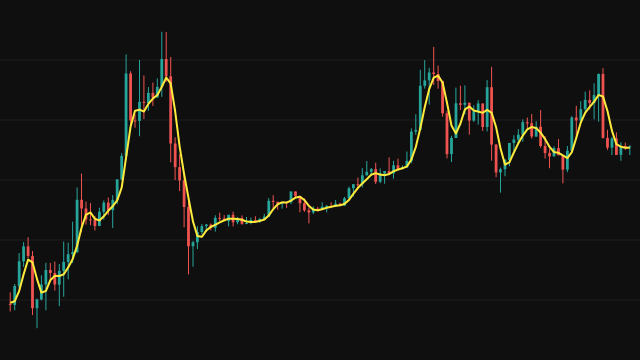
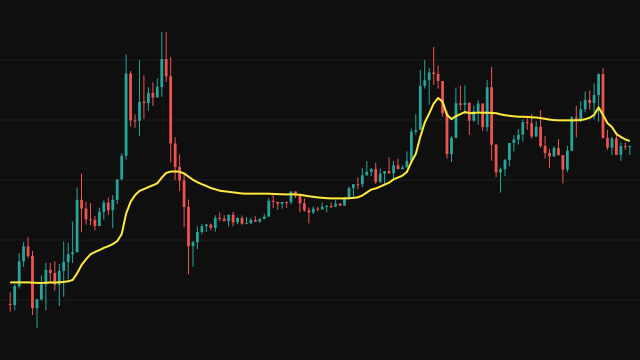
T3 runs the source through six exponential averages in a row, all with a smoothing factor of two over the period plus one. It then blends the last four stages with weights built from the volume factor v: -v^3 on the sixth, 3(v^2 + v^3) on the fifth, -3(2v^2 + v + v^3) on the fourth and 1 + 3v + 3v^2 + v^3 on the third. The weights add up to one, so the line stays on the price scale.
All six stages are seeded with the first source value, and that value is drawn on the first bar, so the line has no warmup gap. The volume factor controls the trade between smoothness and lag: at zero the output is the third stage alone, and as it rises toward one the blend pushes the line closer to price.
How to read Tillson T3 Moving Average (T3)
T3 is read as a smooth trend line that stays close to price. Price above a rising T3 describes an uptrend and price below a falling T3 a downtrend; the line's direction changes less often than a plain EMA of the same responsiveness, so its turns tend to be cleaner.
A higher volume factor makes the line faster and can make it overshoot after a sharp move; a lower one makes it smoother and slower. The six stages also mean the earliest bars still carry the seed value heavily, so give the line some bars before reading it.
Settings
- Source
- The price series that is averaged, the close by default.
- Period
- Sets the smoothing factor of all six stages. A larger period gives a smoother, slower line.
- Volume Factor
- Sets the blend of the last four stages, between 0 and 1. Higher values reduce lag and allow more overshoot.
Frequently asked questions
Does the volume factor use trading volume?
No. It is only a weight between 0 and 1 that sets how the stages are blended. The study never reads volume.
What does a volume factor of zero give?
The weights collapse to one on the third stage, so the line is three chained exponential averages, smooth but slower.
Why does the line start exactly at price?
All six stages are seeded with the first source value, and that value is drawn on the first bar.