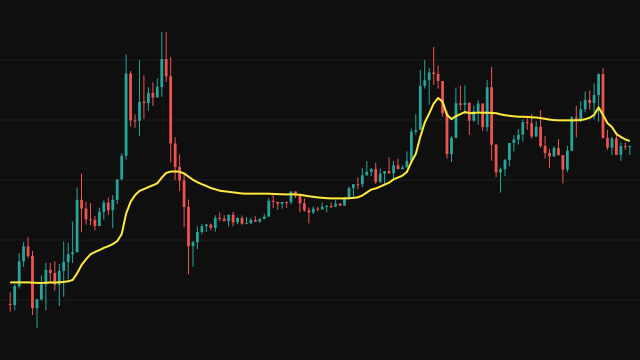
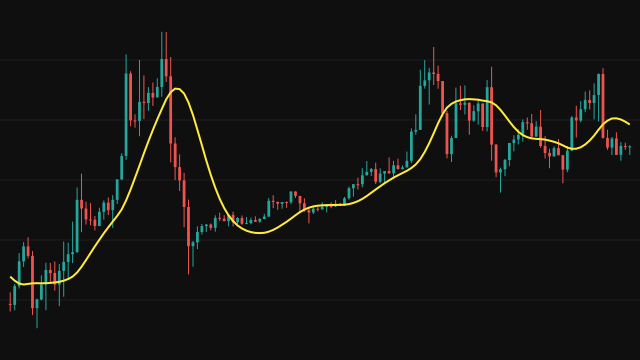
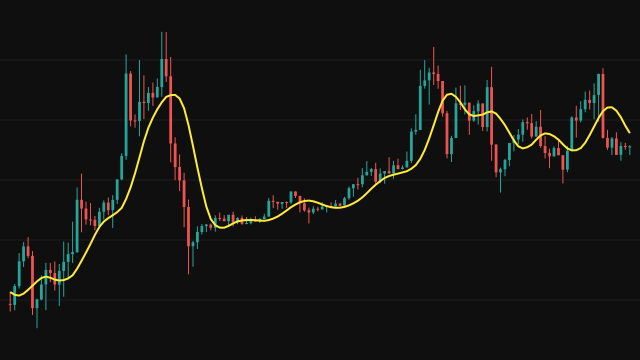
TEMA reduces the lag of an exponential moving average by combining three of them. The first EMA smooths the source, the second smooths the first, and the third smooths the second, all with the same smoothing factor of two over the period plus one. The result is three times the first, minus three times the second, plus the third. The repeated smoothing cancels most of the delay a single EMA carries while keeping much of its smoothness.
Each stage starts at zero. During warmup every stage is divided by its own correction, one minus (1 - alpha) raised to the number of bars seen, so the line starts at the source on the first bar instead of rising slowly from zero. Once (1 - alpha) raised to the bars seen falls below 1e-10, the corrections are dropped and the stages run as plain recursions.
How to read Triple Exponential Moving Average (TEMA)
TEMA hugs price much more closely than an EMA of the same period, so it turns earlier at swing points which suits a reader who wants a fast but still smooth trend line. Price above a rising TEMA describes an uptrend, price below a falling one a downtrend.
The lag reduction has a cost. On sharp moves TEMA can overshoot price briefly, and in a choppy market it turns often. A longer period calms it, at the expense of some of the speed that is the reason to use it.
Settings
- Period
- Sets the smoothing factor shared by all three stages. A larger period gives a smoother, slower line.
- Source
- The price series that is averaged, the close by default.
Frequently asked questions
Is TEMA the same as an EMA applied three times?
No. Three chained EMAs alone would lag even more. TEMA combines the three stages as 3 x EMA1 - 3 x EMA2 + EMA3, which cancels most of that lag.
Why can TEMA move beyond price?
The combination extrapolates the trend, so after a fast move it can briefly overshoot the latest price before the stages catch up.
Why does the line appear from the first bar?
Each stage is divided by a warmup correction that removes the effect of starting at zero, so the first value equals the source.