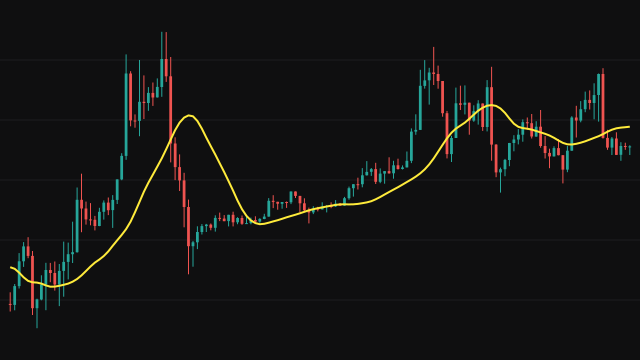
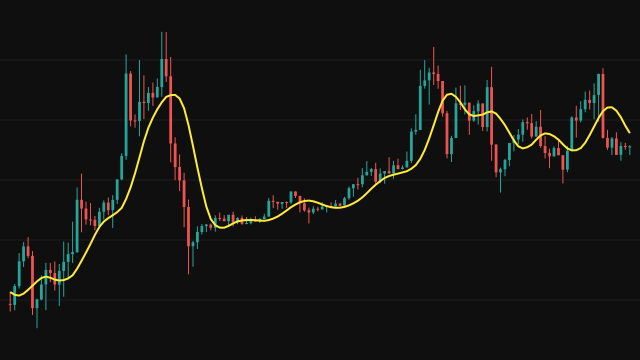
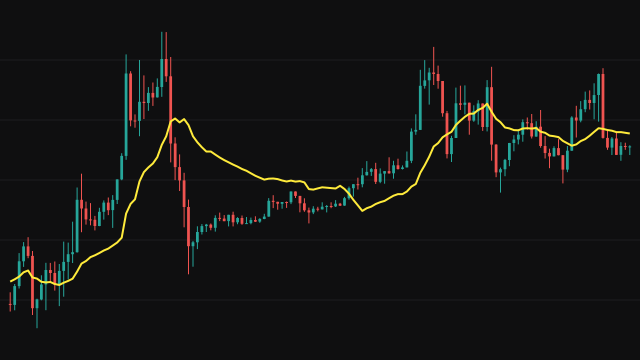
The Time Series Forecast fits a least squares straight line through the last Period values of the source. It then reads that line Forecast Periods - 1 bars past the newest bar of the window and plots the value it reaches there.
With the default forecast of 1 the plotted value is the end point of the fitted line at the newest bar, the same value a linear regression line gives. Each step above 1 reads the line one bar further ahead, so a forecast of 2 is where the fitted line puts the next bar. The first value appears once a full window of Period bars exists. The study also draws the source itself as a thin gray line, so the projection can be compared with the price it was fitted to.
How to read Time Series Forecast
Read the gap between the forecast line and price. While price keeps pace with its recent slope the two stay close; when price falls behind the projection of an uptrend, or above the projection of a downtrend, the move is losing or gaining speed against its own recent pace. The slope of the forecast line itself shows the direction of the fitted trend.
The projection assumes the recent straight-line trend continues. At turning points it overshoots, because it keeps extending the old slope until enough new bars pull the fit round, and a longer forecast overshoots further.
Settings
- Period
- How many bars the straight line is fitted through. Longer is steadier but slower to notice a change in slope.
- Forecast Periods
- Where the fitted line is read: 1 reads it at the newest bar, and each step above 1 reads it one bar further ahead. Larger values lead more and overshoot more at turns.
- Source
- The price series the line is fitted to, the close by default.
Frequently asked questions
How is this different from a linear regression line?
Both fit the same least squares line, and both read it at the newest bar when the forecast is 1, so at the default the two lines are identical. With a forecast of k this study reads the line k - 1 bars further along, so it sits ahead of the regression value by the slope times k - 1.
Why does it overshoot at tops and bottoms?
The line is extended along the slope of the recent window. When price turns, the old slope still dominates the fit for a while, so the projection keeps going in the old direction.
What is the gray line?
It is the source the line was fitted to, drawn so the projection and the price it came from can be read side by side.