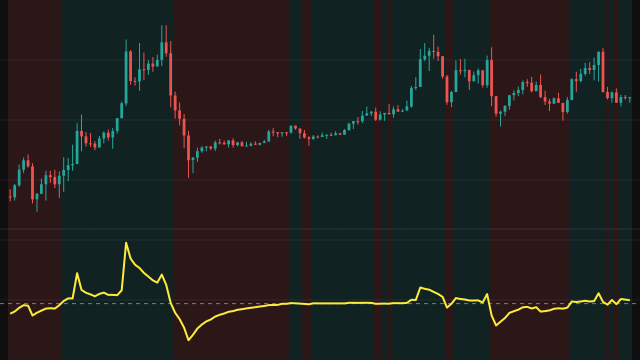
Volume Accumulation measures where each bar closed within its own range and weights that by volume. For every bar the study finds the midpoint of the high and the low, takes the distance from that midpoint to the close, and multiplies it by the bar's volume. A close in the upper half gives a positive amount, a close in the lower half a negative one, and a close exactly in the middle gives nothing.
These amounts are added into a running total that starts at zero on the first bar. Because the distance is in price units rather than a fraction of the range, a wide bar that closes near its high counts for more than a narrow bar that does the same. A bar without volume adds nothing.
The idea is that buyers in control push the close towards the top of the bar and sellers push it towards the bottom, so the total tracks which side has been winning the bars, weighted by how much traded.
How to read Volume Accumulation (VA)
Read the direction of the line. A rising VA means bars have been closing in their upper halves on meaningful volume, a sign of buying pressure; a falling VA means they have been closing low. A divergence, where price makes a new high while VA fails to, suggests the advance is being sold into within the bars.
The absolute level depends on where the chart starts and on the price scale of the instrument, so compare its swings rather than its value. It ignores gaps between bars, because it looks only inside each bar.
Frequently asked questions
How is it different from the accumulation/distribution line?
The accumulation/distribution line uses the close's position as a fraction of the range, from -1 to +1. VA uses the raw distance from the midpoint in price units, so wider bars carry more weight.
Why does a big gap not move the line?
VA looks only at where the close sits inside the bar's own high and low. A gap between the previous close and this bar's range does not enter the calculation.
Does it have any settings?
No. It reads the high, low, close and volume of each bar directly, with nothing to tune.