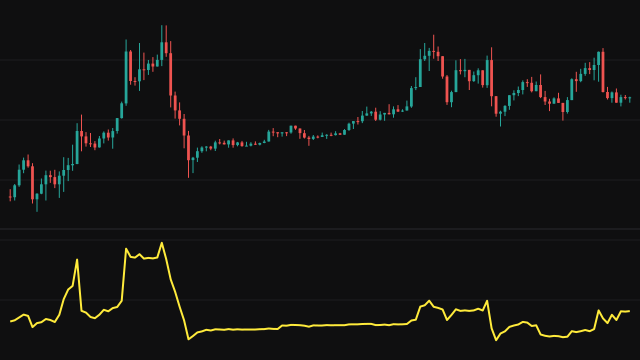
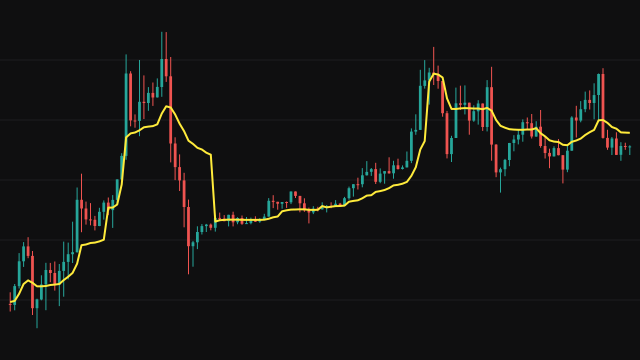
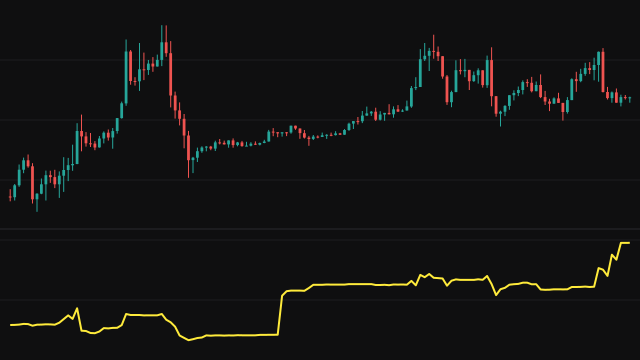
The Volume Weighted Moving Average averages the source over the last period bars, weighting each bar by the volume traded on it. The study keeps two running sums over the window, price times volume and volume alone, and draws the first divided by the second. As a new bar enters the window, the bar that falls out of it is taken out of both sums.
Only bars with volume add to the sums: a bar with zero volume still takes a place in the window but contributes nothing. The line answers from the first bar, averaging however many bars it has until the window fills. If the window holds no volume at all, the line falls back to the source itself.
When every bar in the window trades the same volume, the result equals a simple moving average. The more uneven the volume, the further it moves towards the prices of the busy bars.
How to read Volume Weighted Moving Average (VWMA)
Read it like a simple moving average: price above a rising VWMA is an uptrend, below a falling one a downtrend. The difference is in what it pays attention to. When a move happens on heavy volume, the VWMA follows it more closely than a simple average would, and when price drifts on thin volume, the VWMA barely moves.
Comparing it with a simple average of the same length is useful: VWMA above the simple average means the higher prices in the window came on heavier volume, which supports the move. The first bars of the chart average a partial window and are less reliable.
Settings
- Period
- The number of bars in the window. A longer window gives a smoother, slower line.
- Source
- The price averaged on each bar. The default is the close.
Frequently asked questions
How is VWMA different from VWAP?
VWMA averages over a fixed window of recent bars that slides forward. VWAP accumulates from the start of a period, such as the day, and resets when the next period begins.
Why does the line start on the first bar?
Until the window is full, the average uses only the bars seen so far, so it answers from the first bar rather than waiting out a warmup.
When does it equal a simple moving average?
When every bar in the window has the same volume. Uneven volume pulls it towards the prices of the busier bars.