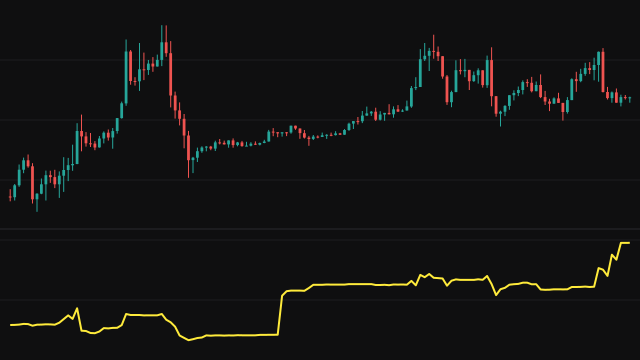
Williams Accumulation/Distribution measures each bar's move against the true range, which stretches the bar's range to include the previous close. On an up close, where the close is above the previous close, the move is the distance from the true range low (the lower of this bar's low and the previous close) up to the close. On a down close, the move is the distance from the true range high (the higher of this bar's high and the previous close) down to the close, which is negative. An unchanged close counts nothing.
The study multiplies each move by the bar's volume and adds it to a running total that starts at zero on the first bar. The first bar compares its close with itself, so it adds nothing, and a bar without volume adds nothing.
Using the true range means gaps count: a bar that gaps up and holds is credited with the gap as well as its own range.
How to read Williams Accumulation/Distribution (WAD)
Read the direction of the line and compare it with price. A rising WAD says up closes have been covering more ground on more volume than down closes, which is accumulation; a falling WAD says the reverse. The most common use is divergence: price making a new low while WAD makes a higher low suggests sellers are losing force.
The level depends on where the chart starts and on the instrument's price and volume scales, so it has no fixed meaning. Look at its swings and how they line up with price swings rather than at its value.
Frequently asked questions
What is the true range used here?
It is this bar's high and low widened to include the previous close if that close lies outside them. It makes gaps between bars part of each bar's move.
Why does an unchanged close add nothing?
The move is only measured when the close differs from the previous close. A close equal to it is treated as neither accumulation nor distribution.
Does it have any settings?
No. It reads each bar's high, low, close, the previous close and the volume directly.