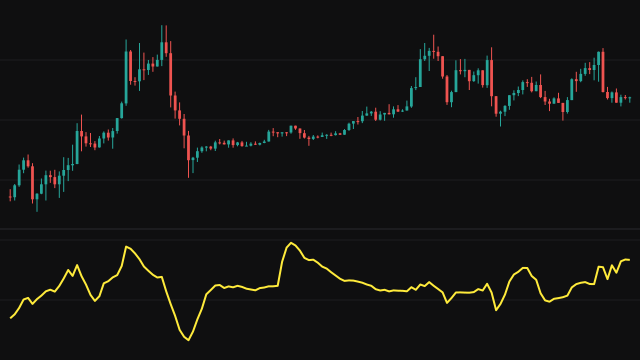
The Accumulation/Distribution Line adds up volume, but it weights each bar's volume by where the bar closed inside its own range. A close at the high counts the full volume as buying, a close at the low counts it as selling, and a close in the middle counts nothing.
On every bar the study computes a money flow multiplier: the close minus the low, less the high minus the close, divided by the bar's range. It runs from +1 at the high to -1 at the low, and is 0 on a bar with no range. That multiplier times the bar's volume is the bar's money flow, and the line is the running total of money flow from the first bar. A bar without volume, or with a missing price, adds nothing, so the line stays flat there.
How to read Accumulation/Distribution Line (ADL)
Read the direction of the line rather than its level, which depends only on where the chart starts. A rising line says volume has been arriving on closes near the highs, which is read as accumulation; a falling line says closes near the lows, read as distribution.
A common use is to look for disagreement with price: price making a new high while the line fails to, or price falling while the line rises. The line ignores gaps between bars, so a market that gaps up and closes near its low still counts as selling.
Frequently asked questions
Why does the line start at a different level on different charts?
It is a running total from the first loaded bar, so its absolute value depends on how much history is loaded. Only its direction and its turns carry meaning.
What does a bar with no range add?
Nothing. When the high equals the low the multiplier is set to 0, so the bar's volume does not move the line.
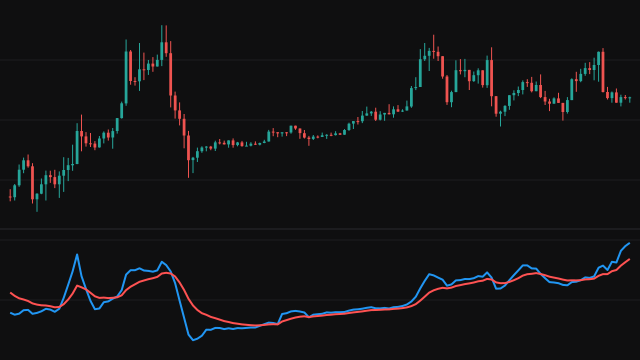
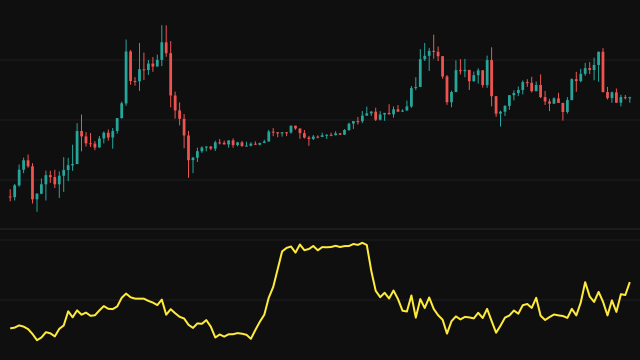
How is it different from on-balance volume?
On-balance volume adds or subtracts the whole bar's volume depending on whether the close rose or fell. This line scales the volume by where the close sits within the bar's own range.