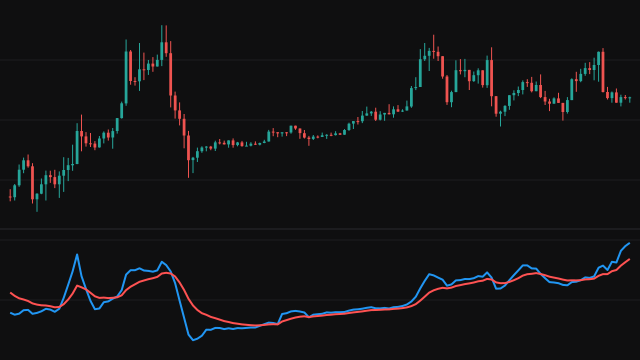
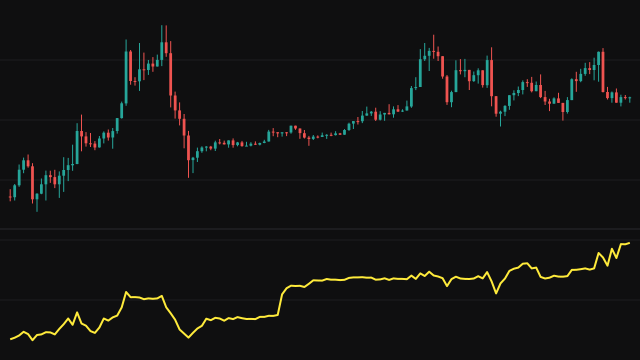
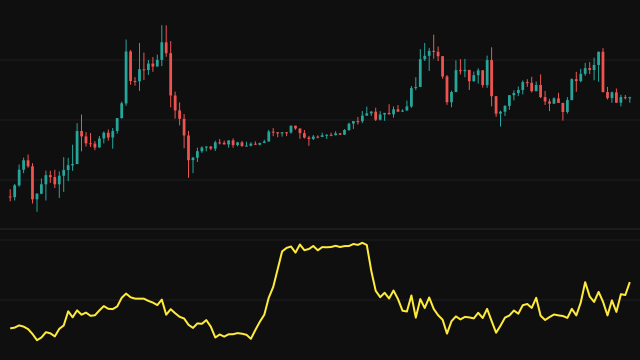
The Chaikin A/D Oscillator measures the momentum of the accumulation/distribution line. That line is a running total of volume weighted by where each bar closes inside its range: the close times two, less the high and the low, divided by the range, times the volume. A bar without volume, without range or with a missing price adds nothing.
The study takes two exponential averages of the line, a fast one over the short period and a slow one over the long period, each started from zero. While a compensating weight, which starts at 1 and shrinks by the slow average's factor on every bar, is above a tiny threshold, both averages are divided by one minus that weight. The correction follows the slow average, so it is exact for the slow one and only approximate for the fast one in the first bars. The oscillator is the fast average minus the slow one. On the first bar the correction is not defined, so the line begins on the second bar.
How to read Chaikin A/D Oscillator (ADOSC)
Above zero, the fast average of the accumulation/distribution line is above the slow one, meaning the line has been rising recently, read as money flowing in; below zero, the reverse, read as money flowing out. A cross of zero marks a change in that balance, and the oscillator often turns before the line itself does.
Disagreement with price is the common use: price at a new high while the oscillator makes a lower peak suggests buying is fading. The scale is in volume units and depends on the instrument, so compare peaks on the same chart only.
Settings
- Short Period
- The length of the fast exponential average of the accumulation/distribution line.
- Long Period
- The length of the slow exponential average. It also sets how quickly the start-up correction fades.
Frequently asked questions
Why is the first bar empty?
The start-up correction divides by a number that is exactly zero on the first bar, so there is no reading until the second bar.
Why are the values so large?
The oscillator is built from a running total of volume, so its scale follows the instrument's volume. Only its sign, its turns and its peaks relative to each other matter.
What is the difference from the accumulation/distribution line?
The line shows the running total. The oscillator shows whether a short average of that total sits above or below a longer one, that is, whether the total has recently been rising or falling.