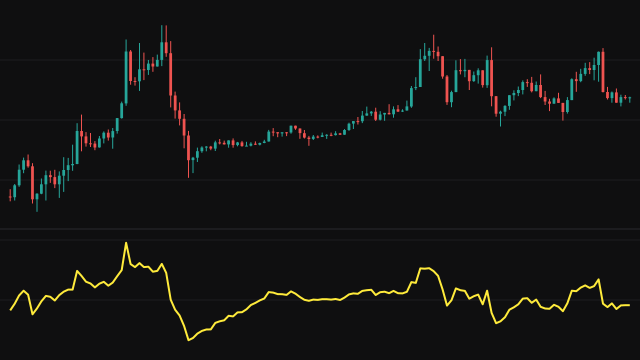
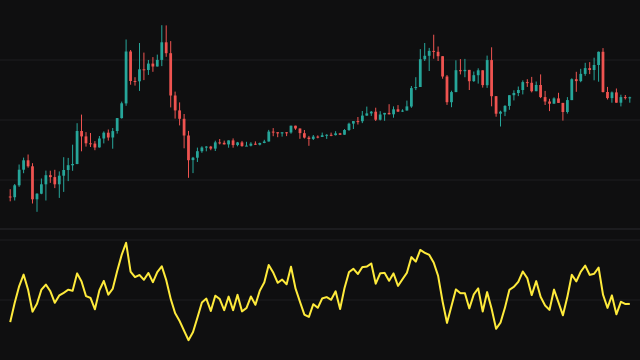
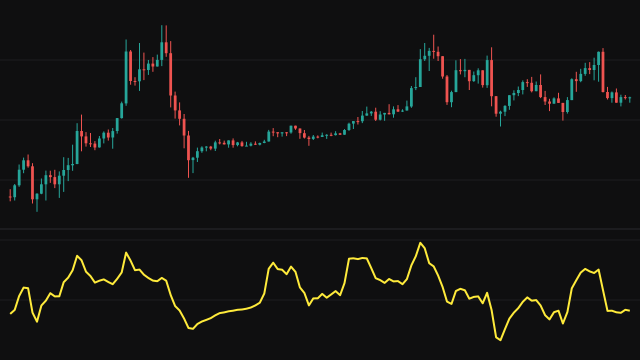
The Accumulation Swing Index adds up a swing index computed on every bar. The swing of a bar is (close - prevClose) + 0.5 * (close - open) + 0.25 * (prevClose - prevOpen): mostly the change in close, with smaller shares of this bar's body and the previous bar's body.
The swing is divided by a range R built from three distances: high to previous close, low to previous close, and high to low. Whichever is widest sets the formula. If high to previous close is widest, R = absHC - 0.5 * absLC + 0.25 * absC1O1; if low to previous close is widest, the two swap; otherwise R = absHL + 0.25 * absC1O1, where absC1O1 is the previous bar's body. The result is scaled by 50 * K / T, where K is the larger of the two distances from the previous close and T is the Limit Move setting.
The first bar has no previous bar and contributes zero, and so does any bar whose R works out to zero. The plotted line is the sum of every bar's swing index from the first bar.
How to read Accumulation Swing Index (ASI)
Read the ASI like a cumulative price line that weighs each bar's conviction. A rising ASI means closes have been pushing up against the prior bars; a falling ASI means they have been pushing down. Breaks of the ASI's own highs and lows, or a divergence between the ASI and price, are the usual ways it is used to confirm or question a breakout.
The zero line is the starting value, not a balance point, so the level of the line depends on where the chart begins. The Limit Move setting scales every value equally and changes the size of the numbers, not the shape of the line.
Settings
- Limit Move
- The scaling constant T. Every swing index is multiplied by K divided by this value, so a larger value shrinks the whole line without changing its shape.
Frequently asked questions
Why does the line start at zero?
It is a running total that begins on the first bar of the chart, and the first bar contributes nothing because it has no previous bar.
Does the Limit Move setting change the signals?
No. It scales every bar's contribution by the same factor, so the line keeps its shape and only its numbers change.
What does a divergence mean here?
If price makes a new high but the ASI does not, the closes behind that high were weaker than before, which questions the strength of the move.