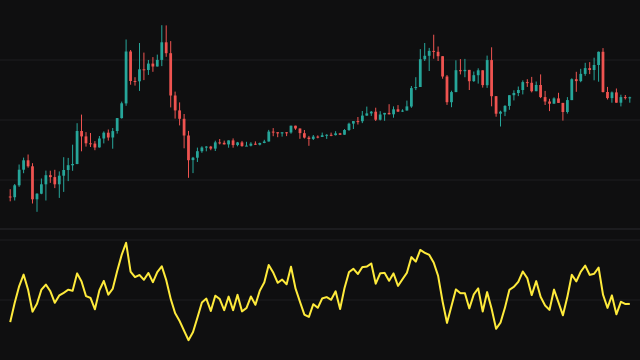
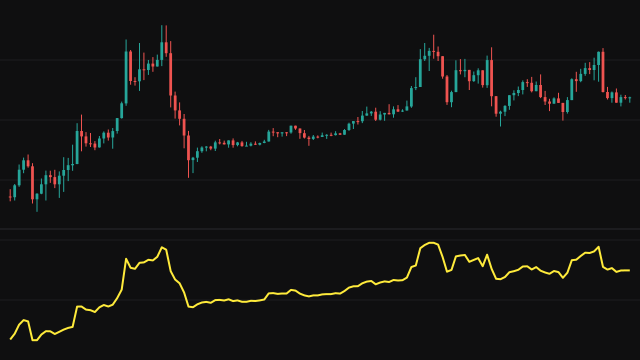
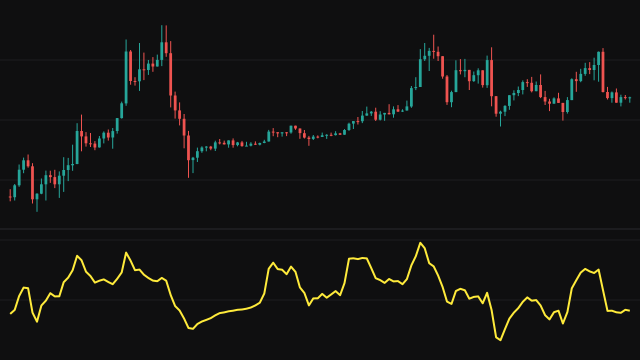
BIAS measures how far price has stretched away from its average. It computes a simple moving average of the source over Length bars and returns (price - average) / average. A reading of 0.02 means price is 2 percent above its average; -0.02 means 2 percent below.
The average is kept as a running sum over the window: each bar adds the new value and removes the one that left the window. Before a full window exists, the average is taken over the bars seen so far, so the line starts on the first bar rather than after a warmup.
Because the result is a fraction of the average, the readings compare across instruments at very different prices.
How to read Bias (BIAS)
Positive values mean price is above its average and negative values mean below. Large readings in either direction show a stretched market; traders often watch for extremes that have reversed before on the same instrument, and for the line crossing zero as price crosses its average.
What counts as extreme depends on the instrument and the length, so judge it against the line's own history. In a strong trend the BIAS can stay stretched for a long time, so an extreme reading is not a signal to fade the move by itself.
Settings
- Source
- The price series compared with its own average, the close by default.
- Length
- How many bars the moving average spans. A longer average gives larger, slower readings.
Frequently asked questions
Why is the value so small?
It is a fraction, not a percentage. Multiply by 100 to read it as a percentage: 0.015 is 1.5 percent above the average.
Why does the line start on the first bar?
Before the window is full, the average uses the bars seen so far. The first bar compares price with itself and reads 0.
Can I compare it across instruments?
Yes. Because it is divided by the average, an instrument at 100 and one at 50,000 give readings on the same scale.