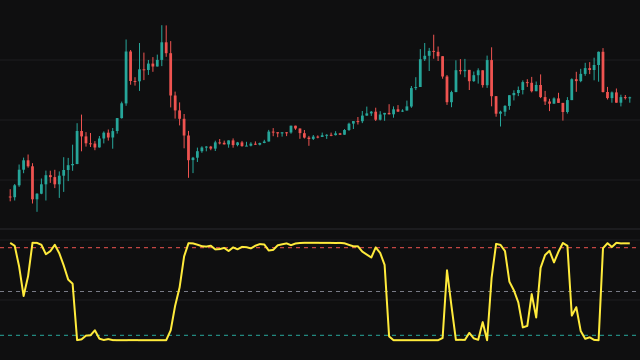
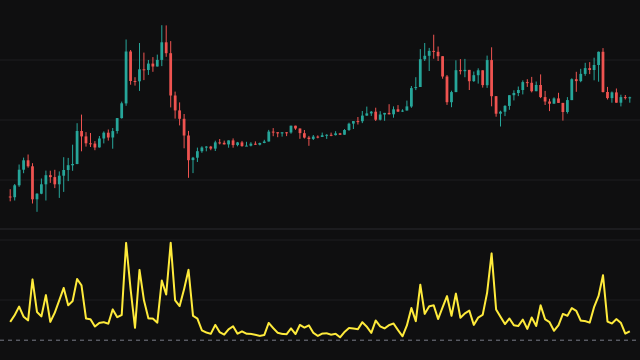
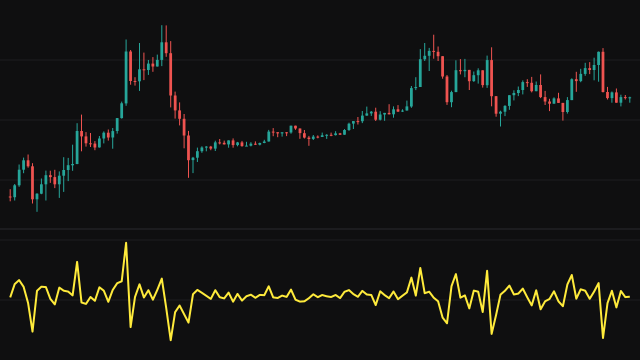
This study turns the position of price in its recent range into a probability. First the source is placed in its own recent range: the lowest value of the last Lookback Period bars maps to 0, the highest to 1, and the current value falls somewhere between. When every value in the window is the same the position is taken as 0.5. Near the start of the chart the window is simply the bars that exist, so the line begins on the first bar.
That position x is then passed through the cumulative distribution function of a Beta(alpha, beta) variable, the regularized incomplete beta function I_x(alpha, beta). It is evaluated with a continued fraction (the modified Lentz method), using log-gamma values from the Lanczos approximation, and switches to the mirrored form 1 - I_(1-x)(beta, alpha) past the distribution's mean so the fraction converges quickly.
The two shape settings decide how the raw range position is bent. With both at 1 the output equals the position itself. Larger equal values make the curve steep around the middle of the range and flat toward the ends, so a position away from the centre is pushed toward 0 or 1 and the line spends more time near the extremes; unequal values tilt the curve toward one end.
How to read Beta Distribution CDF (BETADIST)
Read it as a range oscillator from 0 to 1. Near 1 the source is close to the top of its recent range, near 0 close to the bottom, and 0.5 is the middle. The dashed lines at 0.95 and 0.05 mark the extremes where price is pressing against the edge of its window, and the dotted line at 0.5 the midpoint.
The reading is relative to the window only: a strong trend can hold the line near 1 for a long time, and a new high always reads at the top whatever its size. The shape settings change how quickly the line moves into the extreme zones, not where the range itself is.
Settings
- Source
- The price series that is placed within its range, the close by default.
- Lookback Period
- How many bars, the current one included, set the highest and lowest values the source is scaled against. A longer window changes the reading more slowly.
- alpha
- The left shape of the distribution. Below 1 the curve rises quickly near the bottom of the range; above 1 it weights the reading toward the centre.
- Beta
- The right shape of the distribution. Below 1 the curve rises sharply near the top of the range; above 1 it weights the reading toward the centre.
Frequently asked questions
What do alpha and beta of 1 give?
A straight line: the cumulative Beta(1, 1) distribution is the uniform one, so the output equals the plain range position from 0 to 1.
Why does the line sit at 0 or 1 for long stretches?
Every new high in the window places the source at exactly the top of its range, and every new low at the bottom. In a steady trend that happens bar after bar, so the line stays pinned at the edge.
Does a reading of 0.95 mean a 95 percent chance of anything?
No. It is the value of a distribution function applied to the range position. It says where price sits in its window after reshaping, not a forecast.