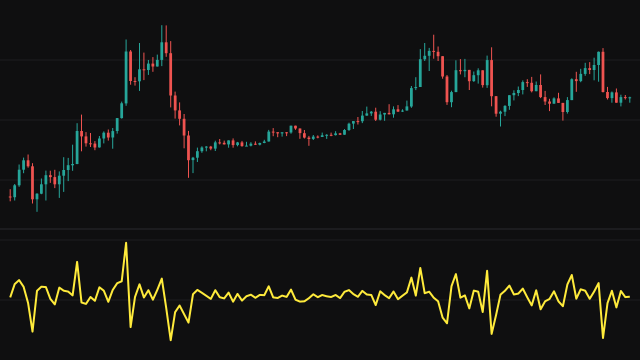
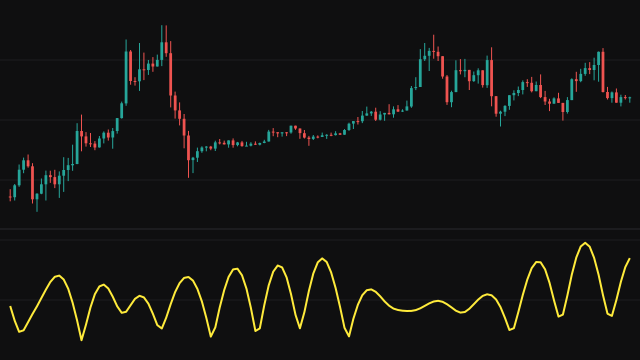
This study reads the position of price in its recent range as a probability and runs it through the binomial distribution. First the source is placed in its own recent range: the lowest value of the last Lookback Period bars maps to 0, the highest to 1, and the current value falls somewhere between. When every value in the window is the same the position is taken as 0.5. Near the start of the chart the window is simply the bars that exist, so the line begins on the first bar.
That position is used as the success probability p of a single trial. The plot is the cumulative binomial probability P(X <= k): the chance of at most Threshold (k) successes in Trials (n) independent trials, the sum of C(n, i) p^i (1 - p)^(n - i) for i from 0 to k. Each term is built in logarithms, with the binomial coefficients from the Lanczos log-gamma approximation, so large trial counts stay accurate. When p is exactly 0 the answer is 1, and when p is exactly 1 it is 1 only if k is at least n.
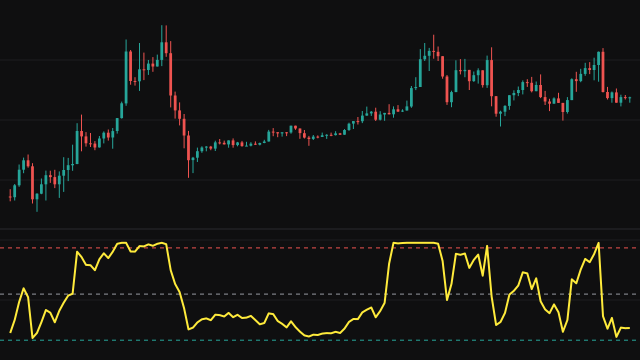
Because a higher p makes many successes more likely, the probability of few successes falls as price rises in its range, so the line moves opposite to the range position.
How to read Binomial Distribution CDF (BINOMDIST)
With the default settings, n of 20 and k of 10, the line is near 1 while price sits low in its range and falls toward 0 as price climbs to the top. It crosses 0.5 a little above the middle of the range, since at p = 0.5 the reading is about 0.59. The dashed lines at 0.95 and 0.05 mark where the reading is all but certain either way, so a value below 0.05 means price is near the top of its window and above 0.95 near the bottom.
Raising n makes the change from 1 to 0 sharper, so the line behaves more like a switch; moving k shifts the point in the range where that change happens. The reading is relative to the window only and carries no forecast.
Settings
- Source
- The price series that is placed within its range, the close by default.
- Lookback Period
- How many bars, the current one included, set the highest and lowest values the source is scaled against. A longer window changes the reading more slowly.
- Trials (n)
- The number of trials n. More trials make the line change more abruptly from 1 to 0 as price moves through its range.
- Threshold (k)
- The success count k the probability is taken up to. A higher k moves the point where the line falls toward the top of the range.
Frequently asked questions
Why does the line fall when price rises?
It is the probability of at most k successes. As price moves up its range, p rises, many successes become likely and few successes become unlikely, so P(X <= k) drops.
What happens if the threshold is above the number of trials?
The sum stops at n, every possible outcome is counted and the line sits at 1 on every bar.
Why are the values so close to 0 and 1 most of the time?
With 20 trials the binomial distribution is fairly narrow, so the cumulative probability changes quickly around the middle of the range and is near one extreme elsewhere. Fewer trials give a gentler curve.