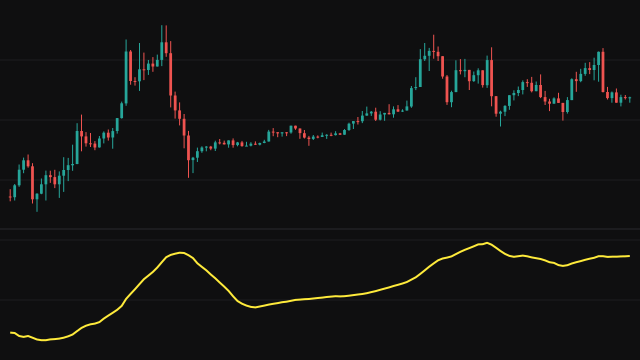
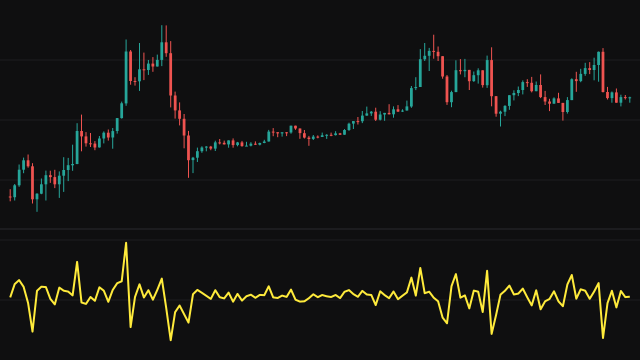
This study measures how much of one particular cycle length is present in the recent price history. It slides a Morlet wavelet, a cosine and sine wave wrapped in a bell-shaped Gaussian envelope, across the most recent bars and adds up the products, which is a convolution at a single scale.
The wavelet spans three scales on each side of its centre, so it reads the last 2 x round(3 x Scale) + 1 bars. At each tap the Gaussian weight is e^(-t^2 / 2), with t the tap's offset divided by the scale, and the wave turns at Omega radians per unit of t. The real and imaginary sums are combined into a magnitude and divided by the square root of the scale, so readings at different scales are comparable. History before the first bar counts as zero.
Because the wavelet is centred halfway back in its window, the reading describes the price action around that point rather than the newest bar alone.
How to read Continuous Wavelet Transform (CWT)
A high value means the price history carries a strong oscillation near the cycle length the scale and omega pick out, or a large move that the wavelet responds to; a low value means that rhythm is weak. Rising readings show a cycle or swing of that size building, falling readings show it fading.
The output is a magnitude in price units, so it is always positive and has no zero line to cross. It also responds to the price level itself, more so at long scales and low omega, and the first bars of the chart are lower because the missing history counts as zero. Compare it within one chart and one setting rather than across instruments.
Settings
- Source
- The price series the wavelet is run over, the close by default.
- Scale
- The width of the wavelet. Higher values reach further back and respond to longer, slower cycles.
- Omega (Central Frequency)
- How many waves fit inside the envelope. The standard value is 6; higher values give finer frequency detail and a less precise position in time.
Frequently asked questions
Which cycle length does a scale pick out?
For the Morlet wavelet the period it responds to most is roughly 2 x pi x Scale / Omega bars. With the defaults, scale 10 and omega 6, that is about 10 bars.
Why is the line low at the start of the chart?
The wavelet reads bars before the first one as zero, so until the whole window has real history the sum is incomplete.
Why is the value never negative?
It is the magnitude of a complex response, the square root of the real part squared plus the imaginary part squared, so it measures strength and not direction.