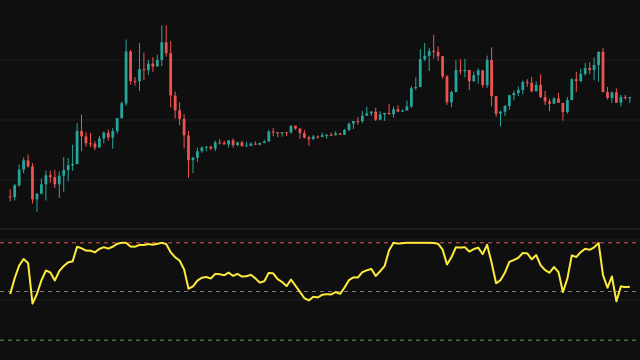
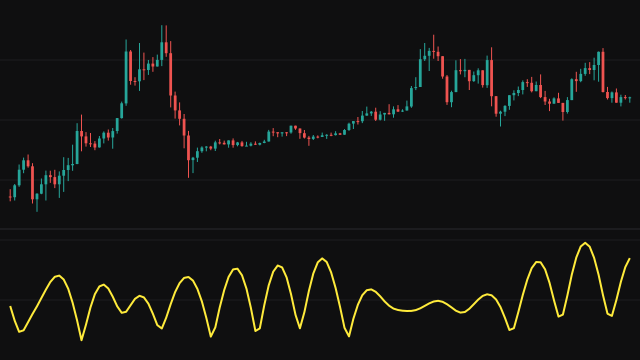
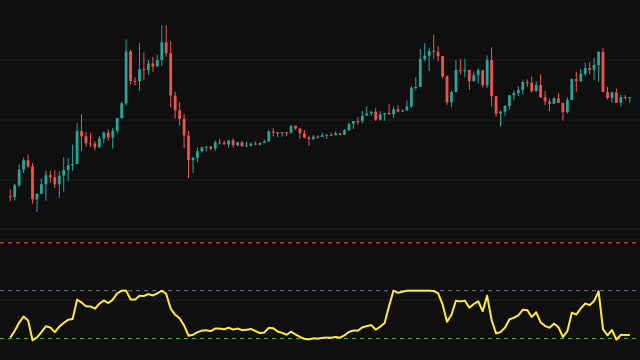
This study splits the source into a smooth trend and a set of detail layers with a stationary, a trous Haar wavelet. Each level averages the previous approximation with itself a fixed number of bars back, and the lag doubles from level to level: 1 bar at level 1, 2 at level 2, 4 at level 3, up to 128 at level 8. The detail at a level is what that averaging removed, the previous approximation minus the new one.
With Output Component at 0 the plot is the approximation at the deepest level, a smoothed trend whose lookback is about 2 to the power of the level count. With a value from 1 to 8 it is the detail at that level instead, the part of price movement in that band of cycle lengths. A component above the level count is read as the deepest detail available. Where a lagged value does not exist yet, near the start of the chart, the current one is used instead.
Adding all the detail layers to the deepest approximation gives back the source exactly, which is what makes the decomposition useful for separating trend from noise.
How to read Discrete Wavelet Transform (DWT)
At component 0 read the line as a trend filter on the price chart's own scale: more levels make it smoother and slower. At a detail component the line oscillates around the dotted zero line: above zero the finer approximation one level up (the source itself at level 1) is above the smoother one at that level, below zero it is beneath it. Low levels hold bar to bar noise, higher levels hold slower swings.
The approximation lags price, roughly by half its lookback, and the detail layers only describe movement that has already happened. Use the trend for direction and a detail layer to see the swings of one size on their own.
Settings
- Source
- The price series that is decomposed, the close by default.
- Decomposition Levels
- How many times the series is halved into a smoother approximation. Each extra level doubles the lookback, so the trend becomes smoother and slower.
- Output Component
- Which layer to plot: 0 for the smooth approximation, or 1 to 8 for the detail at that level. A value above the level count shows the deepest detail.
Frequently asked questions
Why is it called stationary or a trous?
The series is never downsampled. Instead of dropping every other bar, each level spreads its average over a wider gap, so every level has a value on every bar and nothing shifts when a new bar arrives.
What does component 1 show?
The finest detail: half the difference between each bar and the one before it. It is mostly bar to bar noise.
How long is the lookback?
About 2 to the power of the level count, so 16 bars at the default of 4 levels and 256 at 8.