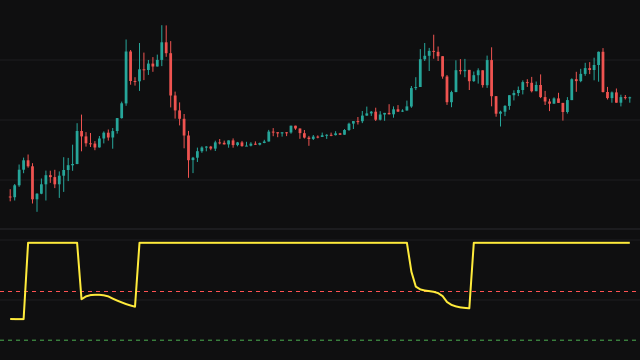
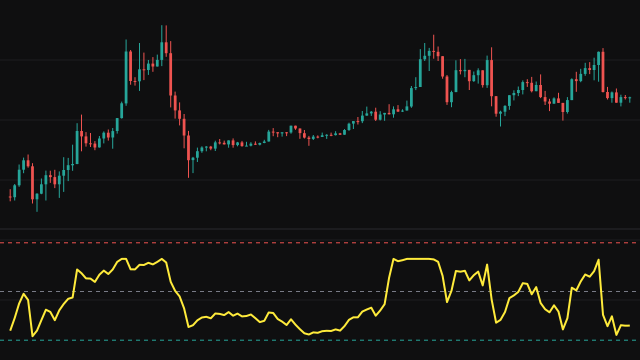
This study reads the position of price in its recent range through the cumulative distribution of an F variable. First the source is placed in its own recent range: the lowest value of the last Lookback Period bars maps to 0, the highest to 1, and the current value falls somewhere between. When every value in the window is the same the position is taken as 0.5. Near the start of the chart the window is simply the bars that exist, so the line begins on the first bar.
That position is used as the F value x. Its cumulative probability with d1 and d2 degrees of freedom equals the regularized incomplete beta function I_t(d1 / 2, d2 / 2) at t = d1 x / (d1 x + d2). The study evaluates it with a continued fraction (Lentz's method), using log-gamma values from the Lanczos approximation, and switches to the mirrored form past the mean so the fraction converges quickly.
Since x only runs from 0 to 1, the line uses the lower part of the F distribution: at the top of the range, with the default 5 and 5 degrees of freedom, the reading is 0.5. The two degrees of freedom change how quickly the line rises off the bottom of the range and how high it can go.
How to read F-Distribution CDF (FDIST)
Read it as a range oscillator that starts at 0 when price is at the bottom of its window and rises as price climbs. With d1 and d2 equal the top of the range reads exactly 0.5, the midline, so with the defaults the line never reaches the upper level at 0.95. A d2 larger than d1 lifts that ceiling a little (about 0.53 at d1 5 and d2 8, about 0.68 at d1 1 and d2 100) and a d1 larger than d2 lowers it. The lower level at 0.05 marks price pressing on the bottom of its window.
The reading is relative to the window only and its scale depends on the two settings, so compare values within one setup. It is a reshaped range position, not a statistical test of anything on the chart.
Settings
- Source
- The price series that is placed within its range, the close by default.
- Lookback Period
- How many bars, the current one included, set the highest and lowest values the source is scaled against. A longer window changes the reading more slowly.
- d1 (numerator df)
- The numerator degrees of freedom. Raising it makes the line climb more slowly from the bottom of the range and lowers the reading at the top.
- d2 (denominator df)
- The denominator degrees of freedom. Raising it lets the line climb a little higher, so the top of the range reads above 0.5.
Frequently asked questions
Why does the line stop at 0.5 with the default settings?
The range position is at most 1. For an F distribution with equal degrees of freedom the probability of a value at or below 1 is exactly one half, so the top of the range reads 0.5.
Can it reach the upper level at 0.95?
No. The highest reading is the F probability at 1. With both degrees of freedom at 1 or more it stays between about 0.32 and 0.68: raising d2 relative to d1 moves it up, raising d1 moves it down. Even the smallest allowed d1 of 0.1 with a large d2 only reaches about 0.88.
Is it a test of whether two variances differ?
No. The F distribution only supplies the shape of the curve. The input is where price sits in its own range, not a ratio of variances.