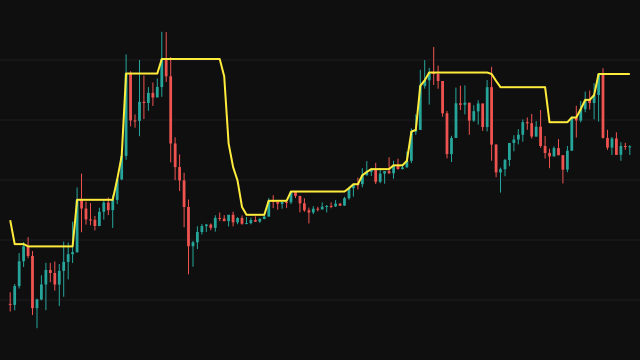
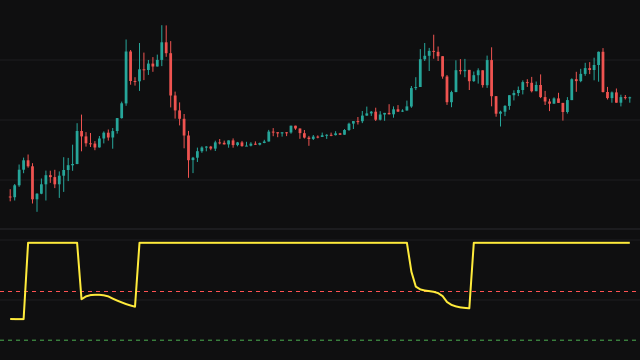
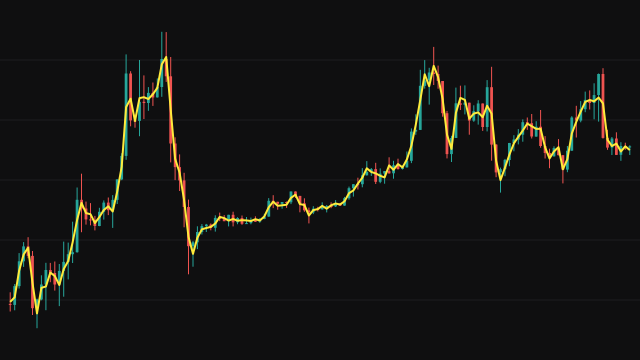
This study turns the position of price inside its recent range into a probability. First it min-max normalises the source over the lookback window: 0 at the lowest value of the window, 1 at the highest, and 0.5 when the window is flat. That position is multiplied by the rate beta, and the result is passed to the cumulative distribution function of a gamma distribution with shape alpha.
The gamma CDF is the regularized lower incomplete gamma function. Below alpha + 1 it is summed as a series, and above it the complement is found with a continued fraction, both to a tolerance of 1e-10, with the gamma function itself from the Lanczos approximation. While fewer than period bars exist, the range is taken over every bar so far, so the line answers from the first bar.
How to read Gamma Distribution CDF (GAMMADIST)
Values near 1 mean price is near the top of its recent range and values near 0 mean it is near the bottom. Unlike a plain range position, the gamma curve bends the scale: with the default shape of 2 and rate of 3, the bottom of the range maps to 0, the middle to about 0.44, and the top to about 0.80. Raising the rate pushes more of the range towards 1, and raising the shape pushes it towards 0.
The reference lines at 0.05, 0.5 and 0.95 mark the tails and the middle of the distribution. A reading above 0.95 needs both price near the top of the range and a rate large enough for the curve to reach that far, so check the settings before reading it as an extreme.
Settings
- Source
- The series whose position inside its own high-low range is measured.
- Lookback Period
- How many bars set the high and low used to normalise the source. A longer window gives a wider range and a slower oscillator.
- Shape (alpha)
- The shape of the gamma distribution. Below 1 the curve rises steeply from zero, at 1 it is exponential, and above 1 it is S-shaped and shifted to the right.
- Rate (beta)
- Multiplies the normalised position before the CDF is applied. A higher rate stretches the range further along the curve, so the top of the range reads closer to 1.
Frequently asked questions
Why does the line not reach 1 at the top of the range?
The top of the range maps to the CDF at the rate value. With a shape of 2 and a rate of 3 that is about 0.80. Raise the rate to let the top of the range read higher.
What happens when the window is flat?
A window with no range puts the position at 0.5, which is then scaled by the rate and passed through the curve like any other position.
Does the line need a warmup?
No. Until period bars exist, the range is taken over every bar seen so far, so the line has a value from the first bar.