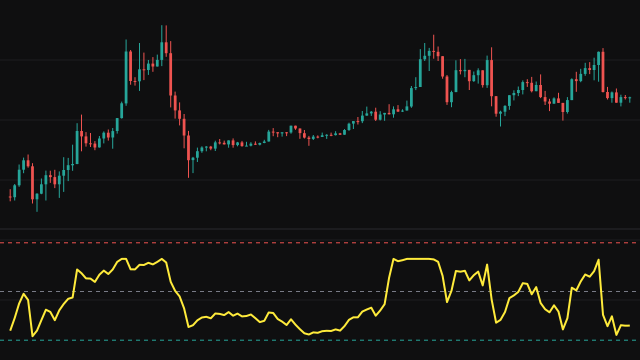
This study looks for the cycle that carries the most energy in recent price. On each bar it takes the last N bars of the source, oldest to newest, tapers them with a Hann window, and runs a radix-2 fast Fourier transform over them. Each frequency bin k of the result corresponds to a cycle of N / k bars.
The study searches only the bins whose periods lie between the minimum and maximum period, and picks the one with the largest power. A parabola through that bin and its two neighbours refines the peak between bins, and the dominant period is N divided by the refined bin, clamped into the period band. The maximum period is capped at half the window, the longest cycle the transform can resolve. The line starts once N bars of history exist.
How to read FFT Dominant Cycle (Radix-2 FFT)
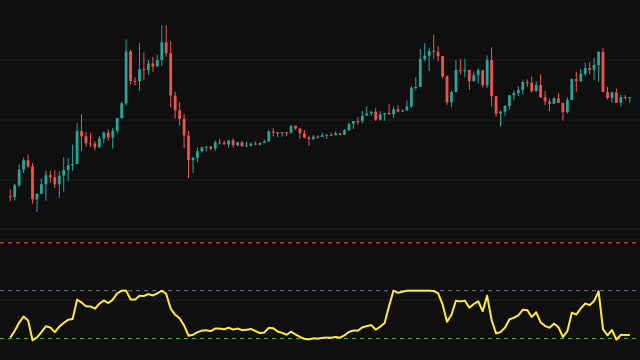
Read the value as the length, in bars, of the cycle that currently dominates price. A low reading means short, choppy swings dominate, and a high reading means price is moving in longer waves. The reference lines at 8 and 20 bars split the pane into fast, middle and slow cycles.
The estimate is often used to tune other studies, for example setting an oscillator's length to half the dominant cycle. It works best when price is actually cycling. In a strong trend the power piles up at the longest periods and the reading sits at the top of the band, which says more about the trend than about a cycle.
Settings
- Source
- The series whose dominant cycle is measured.
- Window Size
- How many bars enter the transform: 32, 64 or 128. Any other value is read as 64. The longest period the transform can resolve is half the window.
- Min Period
- The shortest cycle, in bars, that the search considers. Raising it ignores faster swings.
- Max Period
- The longest cycle, in bars, that the search considers. It is capped at half the window size.
Frequently asked questions
Why is the reading stuck at the maximum period?
The strongest power is at the slowest cycle in the band, which usually means price is trending rather than cycling. Widen the window or treat the reading as a sign of trend.
Why is the value not a whole number?
The peak bin is refined with a parabola through its neighbours, which places the peak between bins and gives a fractional period.
When does the line start?
It needs one full window of history, so it starts once N bars exist: after 64 bars with the default window.