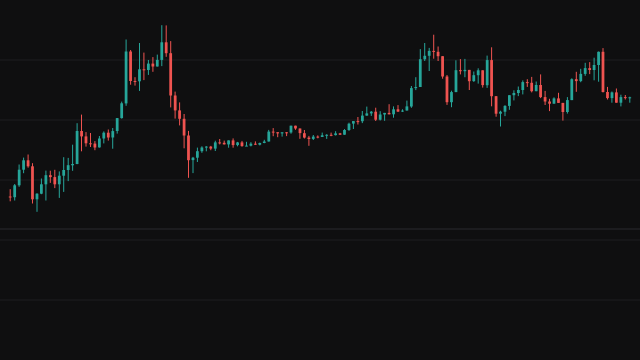
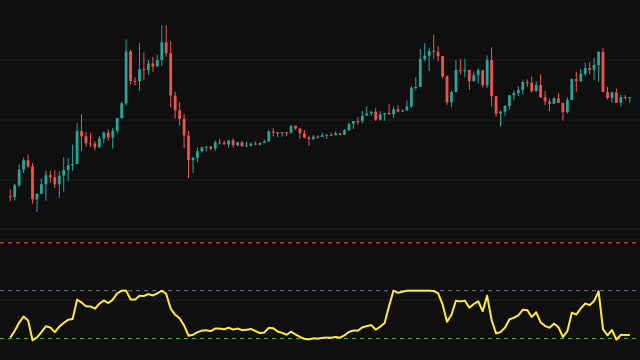
This study maps the position of price in its recent range onto the cumulative exponential distribution. First the source is placed in its own recent range: the lowest value of the last Lookback Period bars maps to 0, the highest to 1, and the current value falls somewhere between. When every value in the window is the same the position is taken as 0.5. Near the start of the chart the window is simply the bars that exist, so the line begins on the first bar.
That position x is passed through 1 - e^(-lambda x). At the bottom of the range the result is 0, and it climbs toward 1 as price moves up, quickly at first and then more slowly. A position at or below zero reads as exactly 0. Because x never exceeds 1, the top of the range reads 1 - e^(-lambda), which is about 0.95 at the default lambda of 3.
Lambda is the rate of the distribution. A larger value makes the curve rise faster, so even a modest lift off the lows reads close to 1.
How to read Exponential Distribution CDF (EXPDIST)
Read it as a range oscillator that is sensitive near the bottom and compressed near the top. A value near 0 means price is at the low of its window; with the default lambda, half the range is about 0.78 and the top of the range about 0.95, near the upper level. The levels at 0.95, 0.5 and 0.05 mark the upper zone, the midline and the lower zone.
Because of the curve's shape, the line is most useful for spotting price lifting off its lows; moves near the top barely change it. With a high lambda it saturates near 1 for most of the range, and with a lambda below 1 it is close to a straight line in the range position but tops out well below 1, about 0.39 at a lambda of 0.5.
Settings
- Source
- The price series that is placed within its range, the close by default.
- Lookback Period
- How many bars, the current one included, set the highest and lowest values the source is scaled against. A longer window changes the reading more slowly.
- Lambda
- The rate of the exponential curve. Higher values make the line rise toward 1 faster as price leaves the bottom of its range.
Frequently asked questions
Why does the line never quite reach 1?
The range position is at most 1, so the highest possible value is 1 - e^(-lambda). At the default lambda of 3 that is about 0.95.
What happens in a flat market?
If every value in the window is the same, the position is taken as 0.5 and the reading is 1 - e^(-lambda / 2), about 0.78 with the defaults.