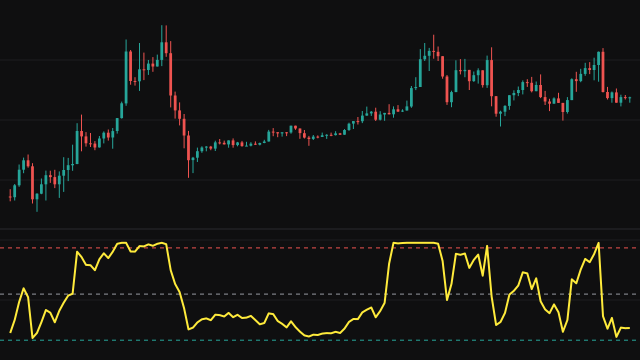
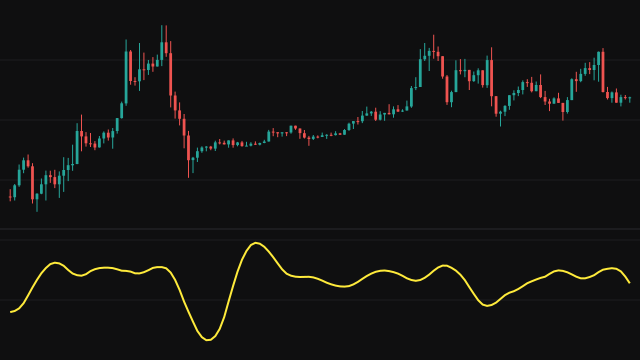
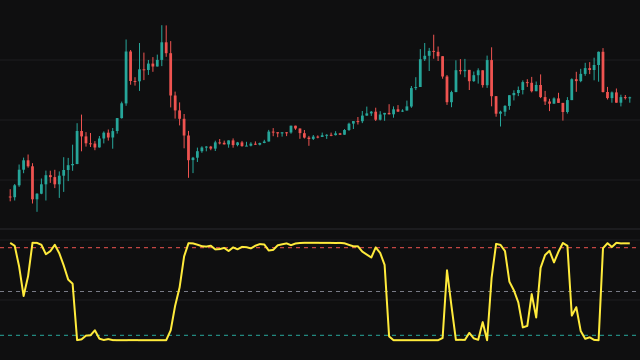
This study treats two values from each bar as the coordinates of a point and plots the angle from the positive x-axis to that point, in radians. By default the y value is the bar's range (high minus low) and the x value is its midpoint (high plus low, over two), but either can be switched to any price series, the range or volume.
Unlike a plain arctangent of y divided by x, the two-argument form keeps both signs, so it can tell a point in one quadrant from the point opposite it and returns a value anywhere from -pi to pi. The study always divides the smaller magnitude by the larger one before taking the arctangent, so the ratio never grows without bound, and then places the angle in its quadrant from the signs of x and y. A bar where both values are zero has no angle and is left blank.
How to read Two-Argument Arctangent (ATAN2)
With the default settings both values are positive, so the angle stays between 0 and pi/2 and works as a smooth, bounded version of the range as a fraction of price: a wider bar relative to its price gives a larger angle. Readings near zero mean the bar was narrow compared with where it traded.
With other choices the line can move into other quadrants, and the reference lines at plus and minus pi/2 and pi mark the quadrant boundaries. The study is a numeric building block: it describes a relationship between two values and does not give trading signals by itself.
Settings
- Y (Numerator)
- The value used as the vertical coordinate: the bar's range, any price series or volume.
- X (Denominator)
- The value used as the horizontal coordinate: the bar's range, any price series or volume.
Frequently asked questions
Why is the default reading so close to zero?
The default angle compares the bar's range with its midpoint price. On most instruments the range is a tiny fraction of the price, so the angle is small, and it rises on wide bars.
Why are some bars blank?
When both chosen values are exactly zero the angle is undefined, so the study leaves that bar empty rather than inventing a value.
Is the output in degrees?
No, it is in radians, from -pi to pi. Multiply by 180 and divide by pi to read it in degrees.