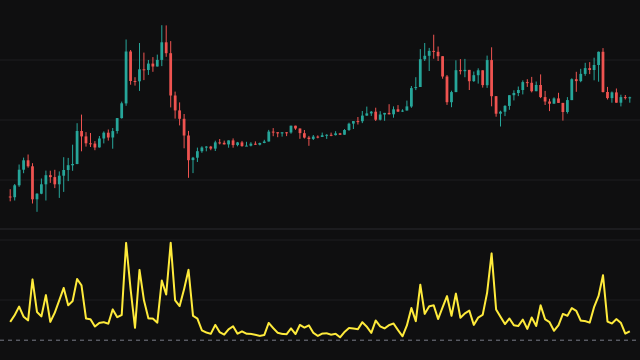
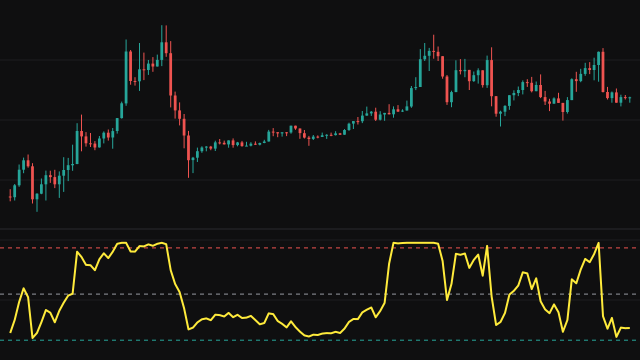
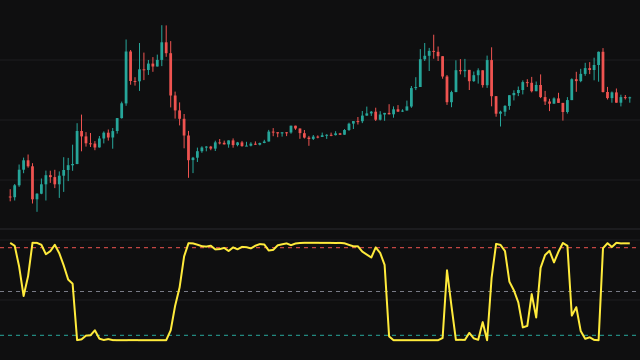
Acceleration measures the change in a trend rather than the trend itself. It fits a straight line to the source over the last Period bars and takes the slope of that line, which is the trend's speed in price per bar. It then fits a second line, over the same number of bars, to that slope series and plots its slope.
Each fit is a rolling least squares line over the last Period bars, where the x value is the bar number. The sums behind it are kept as running totals: each bar adds the newest point and removes the one that left the window. A bar whose value is absent still takes its place in the window but adds nothing to the sums, and a slope needs at least two valid points.
The second fit cannot start until the first has produced two slopes, so the acceleration line begins one bar after the slope would.
How to read Acceleration (Slope of Slope) (ACCEL)
Above zero the trend's slope is rising: an uptrend is getting steeper or a downtrend is flattening. Below zero the slope is falling: an uptrend is losing speed or a downtrend is getting steeper. A cross of zero marks where the trend's speed stopped increasing and started decreasing, or the other way round, which often comes before the trend itself turns.
The values are in price per bar per bar, so they scale with the instrument's price and are not comparable across symbols. A second derivative is noisier than the first, so use a longer period on fast charts.
Settings
- Period
- The number of bars each of the two regression lines is fitted over. A longer period gives a smoother, slower line.
- Source
- The price series the first regression is fitted to, the close by default.
Frequently asked questions
Why is acceleration not just the change in momentum?
Momentum compares two single bars. Here both stages are least squares fits over a window, so every bar in the window counts and a single outlier moves the reading much less.
Does a positive value mean price is going up?
Not necessarily. It means the slope is rising. A downtrend that is slowing down also has positive acceleration while price is still falling.
Why does it start later than the source?
The first fit needs two bars to give a slope, and the second fit needs two of those slopes, so the first value appears on the third bar of the chart.