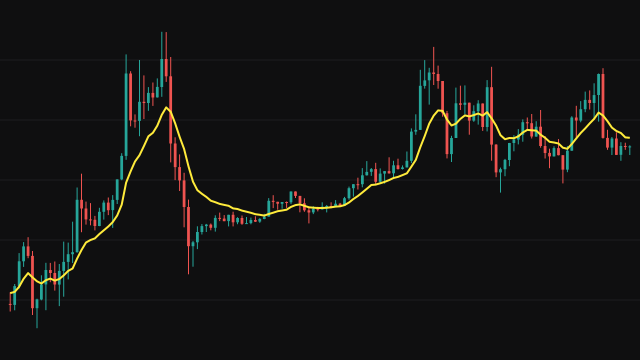
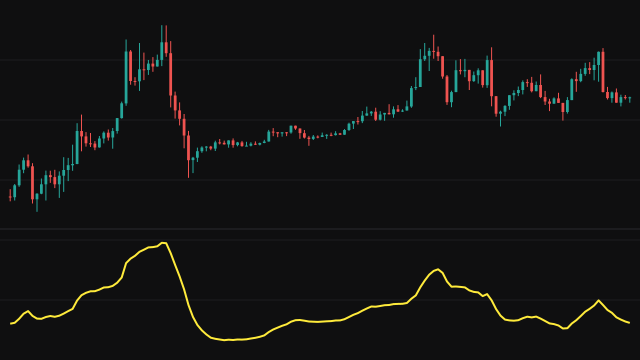
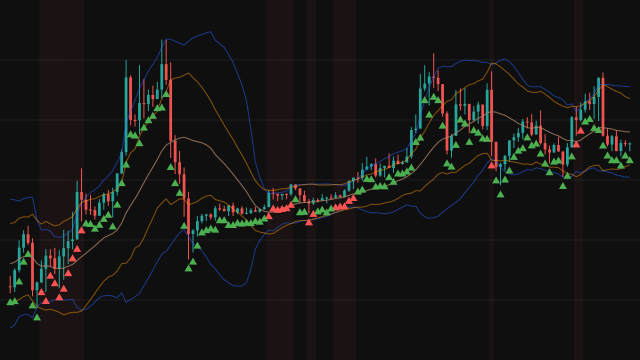
Bollinger %B turns the position of price inside its bands into a single number. The bands are a simple average of the source plus and minus a multiple of its standard deviation. %B is the source minus the lower band, divided by the width between the bands, so 0 is the lower band, 0.5 the middle and 1 the upper band.
The study keeps a running sum and sum of squares over the last Period values and divides by the number of values seen so far, so the bands and %B exist from the first bar rather than after a warmup. The standard deviation is the population form. A window with no spread gives bands of zero width, and %B then reads 0.5.
How to read Bollinger %B
A reading above 1 means price closed above the upper band, and a reading below 0 means it closed below the lower band. Readings above 0.8 and below 0.2 mark the upper and lower parts of the band, and 0.5 is the moving average. In a strong uptrend %B can stay above 0.8 for many bars, so a high reading is a description of strength, not automatically a sell signal.
Comparing %B highs with price highs is a common use: a new price high with a lower %B high says price is less stretched relative to its volatility than it was before.
Settings
- Period
- Number of bars in the average and the standard deviation. Longer periods give smoother bands that react more slowly.
- Source
- The price series placed within the bands, the close by default.
- StdDev Multiplier
- How many standard deviations the bands sit from the average. A larger value widens the bands and keeps %B nearer 0.5.
Frequently asked questions
Can %B go above 1 or below 0?
Yes. Above 1 means price is above the upper band, below 0 means it is below the lower band. The scale is not capped.
Why does the line start on the first bar?
Until the window fills, the average and the deviation use the bars seen so far, so there is a value from the start. The first few bars rest on very little data.
What does a reading of exactly 0.5 on a flat market mean?
When every value in the window is the same, the bands have no width. The study reports the midpoint, 0.5, in that case.