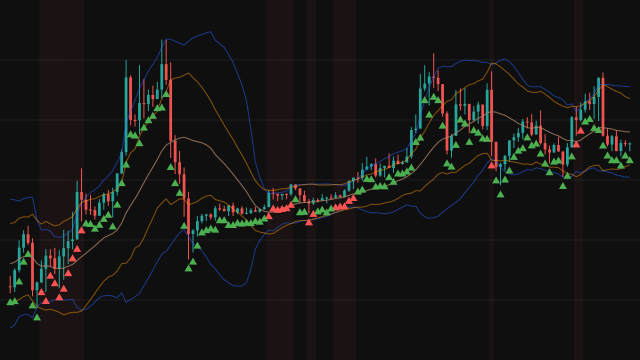
The Bulls Bears Index takes four simple moving averages of the source, by default over 3, 6, 12 and 24 bars, and plots their plain average as a single line on the price chart. Because the four lengths are spread out, the line reacts faster than a 24-bar average on its own but is steadier than a 3-bar one.
Each average is a rolling mean of the last N values. Until N bars exist it averages the bars it has seen so far, so the line starts on the first bar instead of waiting for the longest window to fill. A missing source value counts as zero in the averages.
How to read Bulls Bears Index (BBI)
Read it like a single moving average with a balanced lag. Price closing above the line suggests the blended trend favours buyers, and closing below it suggests sellers have the upper hand. The slope of the line shows the direction of that blended trend.
The first 24 bars or so use shortened windows, so treat the earliest part of the line with care. Like any average it lags turning points and gives many crossings in a sideways market.
Settings
- Source
- The price series the calculation reads, such as the close or the bar midpoint.
- Period 1 (Ultra-Short)
- Length of the shortest of the four averages. A smaller value makes the line hug price more closely.
- Period 2 (Short)
- Length of the second average, the short-term component of the blend.
- Period 3 (Medium)
- Length of the third average, the medium-term component of the blend.
- Period 4 (Long)
- Length of the longest average. A larger value makes the line smoother and slower.
Frequently asked questions
Why is it drawn on the price chart and not in its own pane?
It is an average of prices, so it is in the same units as the candles and is easiest to read laid over them.
Why does the line start on the very first bar?
Each of the four averages uses the bars available while its window is still filling, so there is always a value. The early readings rest on fewer bars than the settings ask for.
How is it different from a single moving average?
It mixes four lengths with equal weight, so short-term moves shift it a little without letting it whip around as much as a short average would.