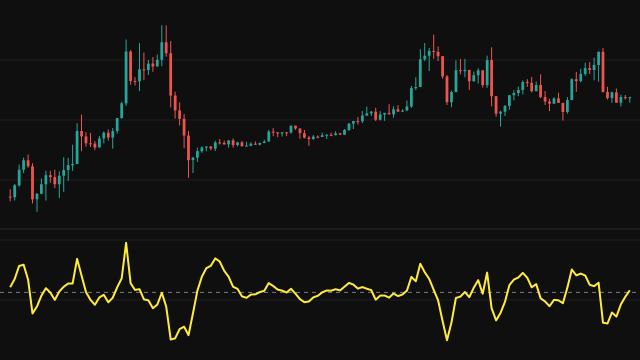
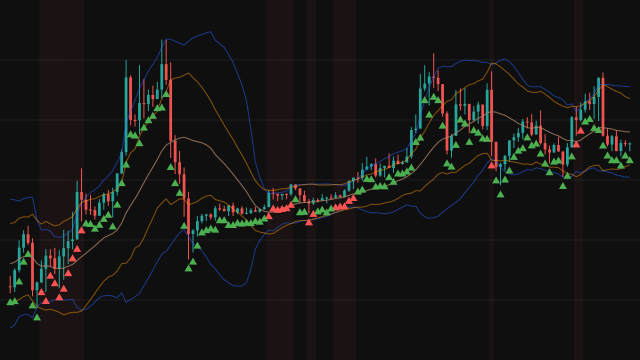
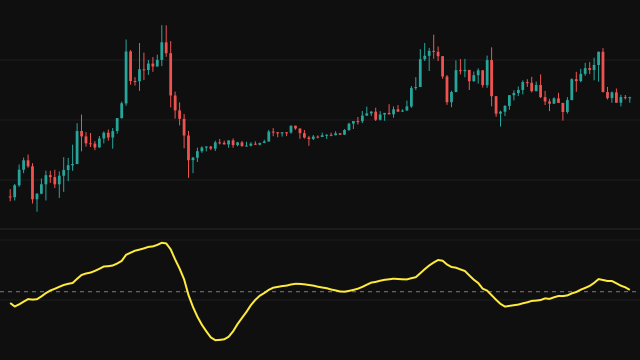
BRAR is a pair of ratios that compare buying strength with selling strength. AR adds up, over the window, how far each bar's high rose above its open and how far its low fell below its open, and divides the first total by the second. BR does the same against the previous bar's close: how far the high reached above it against how far the low fell below it. Negative distances count as zero. Both ratios are multiplied by 100.
The sums cover the bars seen so far until the window fills, so both lines start on the first bar, where the open stands in for the missing previous close. When the lower total is zero, the ratio reads 100.
How to read Bull-Bear Power Ratio (BRAR)
A reading of 100, the equilibrium line, means buyers and sellers pushed equally far. Above 100, prices reached further up than down over the window; below it, sellers had the larger reach. AR reflects the strength within each bar from its own open, while BR also includes any gap from the previous close, so BR often swings more.
Very high readings mean the market has been one-sided for some time, and some traders read them as stretched. The ratios describe the balance of past bars, not a turning point, and BR in particular can stay extreme through a strong trend.
Settings
- Period
- Number of bars summed for both ratios. Longer windows give smoother, slower lines.
Frequently asked questions
What is the difference between BR and AR?
AR measures each bar's reach from its own open, so it ignores gaps. BR measures from the previous close, so a gap up or down counts towards one side.
Why does a ratio sometimes sit at exactly 100?
When the lower total in the window is zero there is nothing to divide by, and the study reports 100, the equilibrium value.
What is a high reading?
Anything well above 100 means the upside reach dominated the window. How high is unusual depends on the instrument, so compare with its own history rather than a fixed number.