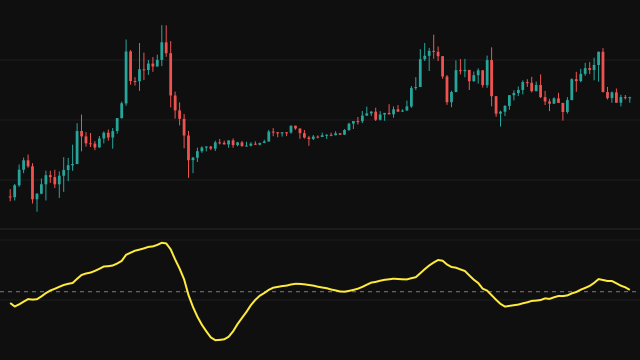
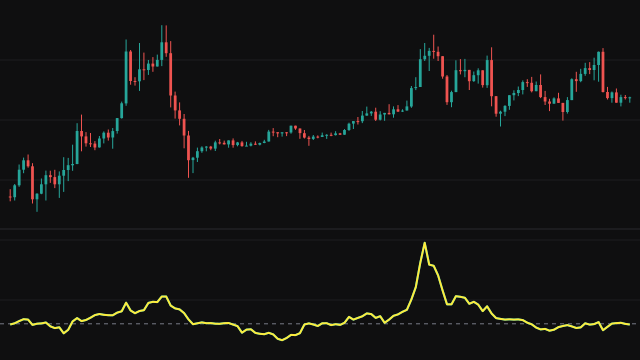
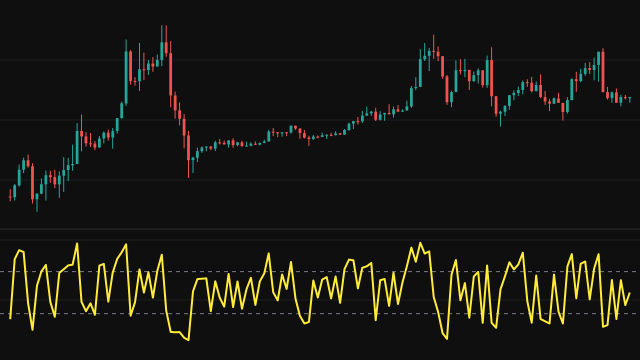
The Chande Forecast Oscillator (CFO) fits a least squares straight line through the last N values of the source and reads that line at the current bar, which is the price the recent trend predicts for now. The oscillator is the difference between the actual price and that forecast, written as a percentage of price.
The fit is kept with running sums over the window, so each bar costs the same no matter how long the period is. Nothing is drawn until the window holds N values, and nothing is drawn on a bar whose price is zero.
How to read Chande Forecast Oscillator
A reading near zero means price is sitting on its own recent trend line. A positive reading means price is above where the trend says it should be, and a negative reading means it is below. Large readings mark a move that is pulling away from the recent path, and a return toward zero shows price settling back onto it.
The forecast is only a straight line through recent bars, so it says nothing about where price goes next; it describes how far the latest bar strays from the recent slope.
Settings
- Period
- How many bars the straight-line fit covers. A longer period gives a slower trend line and larger swings around it.
- Source
- The price series the calculation reads, such as the close or the bar midpoint.
Frequently asked questions
What does a value of 2 mean?
Price is 2 percent above the value the straight-line fit through the last N bars gives for the current bar.
Why is the first part of the pane empty?
The fit needs a full window of N values, so the line starts on bar N minus one.
Can the period be 1?
A one-bar fit has no slope, so the oscillator draws nothing at that setting.