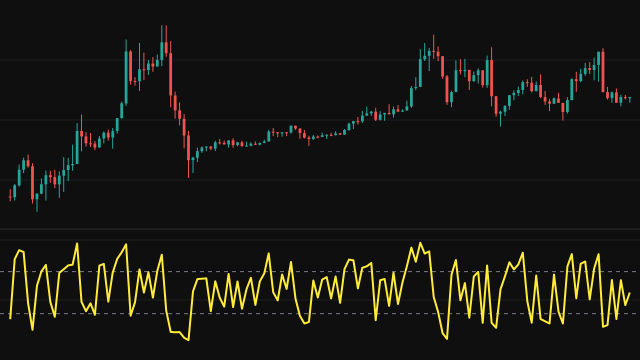
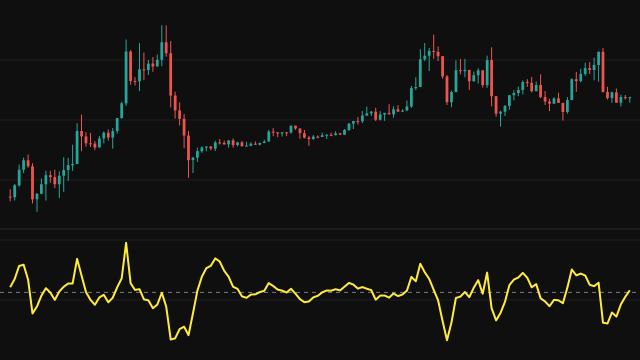
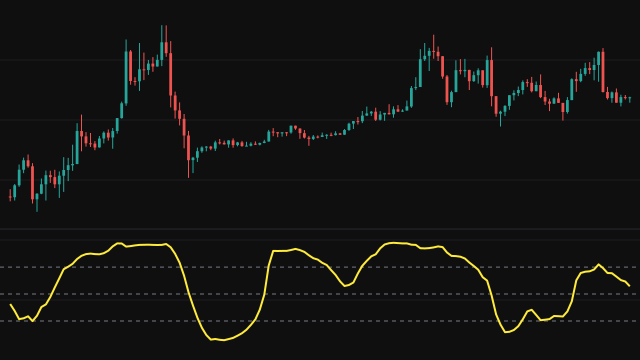
The Coppock Curve adds two percentage rates of change of the source, one over a longer lookback (14 bars by default) and one over a shorter lookback (11 bars), and smooths the sum with a linearly weighted moving average (10 bars), in which the newest value carries the most weight.
Each rate of change counts as zero until its lookback exists. The weighted average uses the values it has while its window fills, weighting them 1 for the oldest up to the count for the newest, so the curve starts on the first bar. A missing source value reads as zero.
How to read Coppock Curve (COPPOCK)
The curve swings around zero. It was designed as a slow momentum gauge: the classic reading is a turn upward while the curve is below zero, which suggests a decline is losing force. A turn down from above zero suggests an advance is fading. Crossings of the zero line show the combined momentum changing sign.
Because both rates of change and the smoothing are long, it reacts late and is best used to confirm a change in direction rather than to time an entry.
Settings
- Source
- The price series the calculation reads, such as the close or the bar midpoint.
- Long ROC Period
- Lookback of the longer rate of change. A larger value makes the curve slower.
- Short ROC Period
- Lookback of the shorter rate of change added to the longer one.
- WMA Period
- Length of the weighted average that smooths the summed rates of change.
Frequently asked questions
What is the signal people watch for?
A turn upward while the curve is below zero. It suggests downside momentum is easing, though it does not say how soon price will follow.
Why are the first readings small?
Each rate of change counts as zero until its lookback exists, so the early sum is missing one or both parts.
Does it work on intraday bars?
The calculation counts bars, so it runs on any timeframe. On short bars it becomes a medium-term momentum line rather than the slow gauge it was built as.